Norwegian vs Immigrants from Europe Births to Unmarried Women
COMPARE
Norwegian
Immigrants from Europe
Births to Unmarried Women
Births to Unmarried Women Comparison
Norwegians
Immigrants from Europe
29.3%
BIRTHS TO UNMARRIED WOMEN
95.8/ 100
METRIC RATING
96th/ 347
METRIC RANK
28.4%
BIRTHS TO UNMARRIED WOMEN
98.7/ 100
METRIC RATING
68th/ 347
METRIC RANK
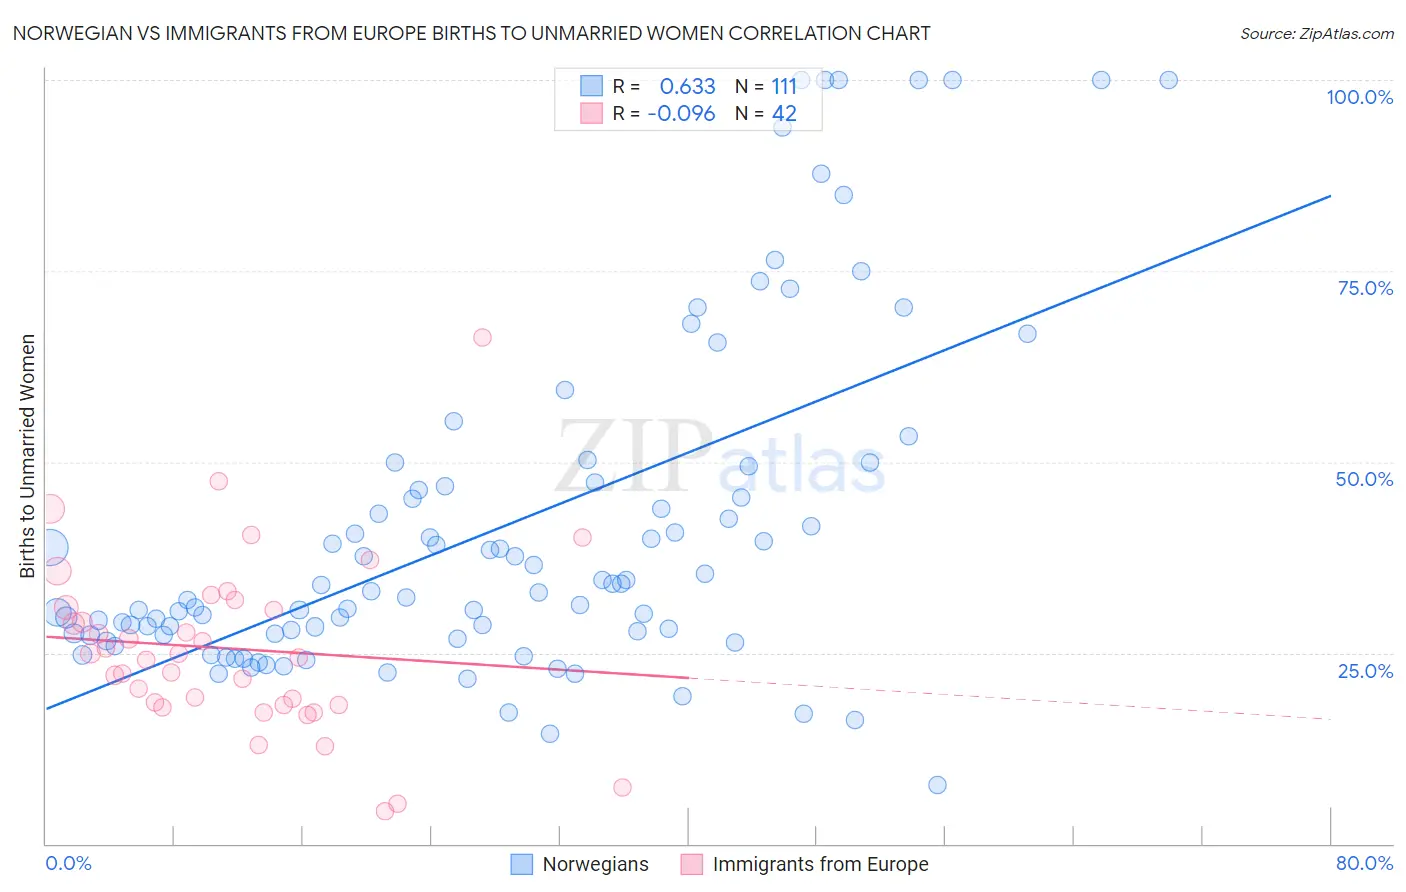
Norwegian vs Immigrants from Europe Births to Unmarried Women Correlation Chart
The statistical analysis conducted on geographies consisting of 477,355,885 people shows a significant positive correlation between the proportion of Norwegians and percentage of births to unmarried women in the United States with a correlation coefficient (R) of 0.633 and weighted average of 29.3%. Similarly, the statistical analysis conducted on geographies consisting of 491,178,975 people shows a slight negative correlation between the proportion of Immigrants from Europe and percentage of births to unmarried women in the United States with a correlation coefficient (R) of -0.096 and weighted average of 28.4%, a difference of 3.2%.
Births to Unmarried Women Correlation Summary
| Measurement | Norwegian | Immigrants from Europe |
| Minimum | 7.7% | 4.2% |
| Maximum | 100.0% | 66.3% |
| Range | 92.3% | 62.1% |
| Mean | 41.3% | 25.5% |
| Median | 32.9% | 24.6% |
| Interquartile 25% (IQ1) | 27.3% | 18.1% |
| Interquartile 75% (IQ3) | 46.7% | 30.9% |
| Interquartile Range (IQR) | 19.4% | 12.8% |
| Standard Deviation (Sample) | 22.3% | 11.6% |
| Standard Deviation (Population) | 22.2% | 11.4% |
Similar Demographics by Births to Unmarried Women
Demographics Similar to Norwegians by Births to Unmarried Women
In terms of births to unmarried women, the demographic groups most similar to Norwegians are Immigrants from South Africa (29.3%, a difference of 0.040%), Immigrants from Syria (29.4%, a difference of 0.070%), Immigrants from Vietnam (29.3%, a difference of 0.23%), Immigrants from Denmark (29.4%, a difference of 0.30%), and Luxembourger (29.4%, a difference of 0.30%).
| Demographics | Rating | Rank | Births to Unmarried Women |
| Immigrants | Saudi Arabia | 97.0 /100 | #89 | Exceptional 29.1% |
| Immigrants | Latvia | 96.8 /100 | #90 | Exceptional 29.1% |
| Immigrants | Fiji | 96.6 /100 | #91 | Exceptional 29.2% |
| Arabs | 96.5 /100 | #92 | Exceptional 29.2% |
| Estonians | 96.5 /100 | #93 | Exceptional 29.2% |
| Ukrainians | 96.3 /100 | #94 | Exceptional 29.2% |
| Immigrants | Vietnam | 96.1 /100 | #95 | Exceptional 29.3% |
| Norwegians | 95.8 /100 | #96 | Exceptional 29.3% |
| Immigrants | South Africa | 95.7 /100 | #97 | Exceptional 29.3% |
| Immigrants | Syria | 95.7 /100 | #98 | Exceptional 29.4% |
| Immigrants | Denmark | 95.3 /100 | #99 | Exceptional 29.4% |
| Luxembourgers | 95.2 /100 | #100 | Exceptional 29.4% |
| Immigrants | Northern Africa | 94.7 /100 | #101 | Exceptional 29.5% |
| Australians | 94.6 /100 | #102 | Exceptional 29.5% |
| Lebanese | 94.4 /100 | #103 | Exceptional 29.5% |
Demographics Similar to Immigrants from Europe by Births to Unmarried Women
In terms of births to unmarried women, the demographic groups most similar to Immigrants from Europe are Bolivian (28.5%, a difference of 0.040%), Palestinian (28.4%, a difference of 0.050%), Laotian (28.5%, a difference of 0.10%), Immigrants from Egypt (28.4%, a difference of 0.16%), and Immigrants from Czechoslovakia (28.4%, a difference of 0.18%).
| Demographics | Rating | Rank | Births to Unmarried Women |
| Immigrants | North Macedonia | 99.1 /100 | #61 | Exceptional 28.1% |
| Egyptians | 99.0 /100 | #62 | Exceptional 28.2% |
| Immigrants | Serbia | 98.9 /100 | #63 | Exceptional 28.3% |
| Tongans | 98.8 /100 | #64 | Exceptional 28.4% |
| Immigrants | Czechoslovakia | 98.8 /100 | #65 | Exceptional 28.4% |
| Immigrants | Egypt | 98.8 /100 | #66 | Exceptional 28.4% |
| Palestinians | 98.7 /100 | #67 | Exceptional 28.4% |
| Immigrants | Europe | 98.7 /100 | #68 | Exceptional 28.4% |
| Bolivians | 98.7 /100 | #69 | Exceptional 28.5% |
| Laotians | 98.6 /100 | #70 | Exceptional 28.5% |
| Jordanians | 98.5 /100 | #71 | Exceptional 28.5% |
| Immigrants | Sweden | 98.5 /100 | #72 | Exceptional 28.5% |
| Albanians | 98.5 /100 | #73 | Exceptional 28.5% |
| Immigrants | Bolivia | 98.5 /100 | #74 | Exceptional 28.6% |
| Immigrants | Switzerland | 98.4 /100 | #75 | Exceptional 28.6% |