Immigrants from Belgium vs Cuban Average Family Size
COMPARE
Immigrants from Belgium
Cuban
Average Family Size
Average Family Size Comparison
Immigrants from Belgium
Cubans
3.15
AVERAGE FAMILY SIZE
0.6/ 100
METRIC RATING
274th/ 347
METRIC RANK
3.25
AVERAGE FAMILY SIZE
81.8/ 100
METRIC RATING
138th/ 347
METRIC RANK
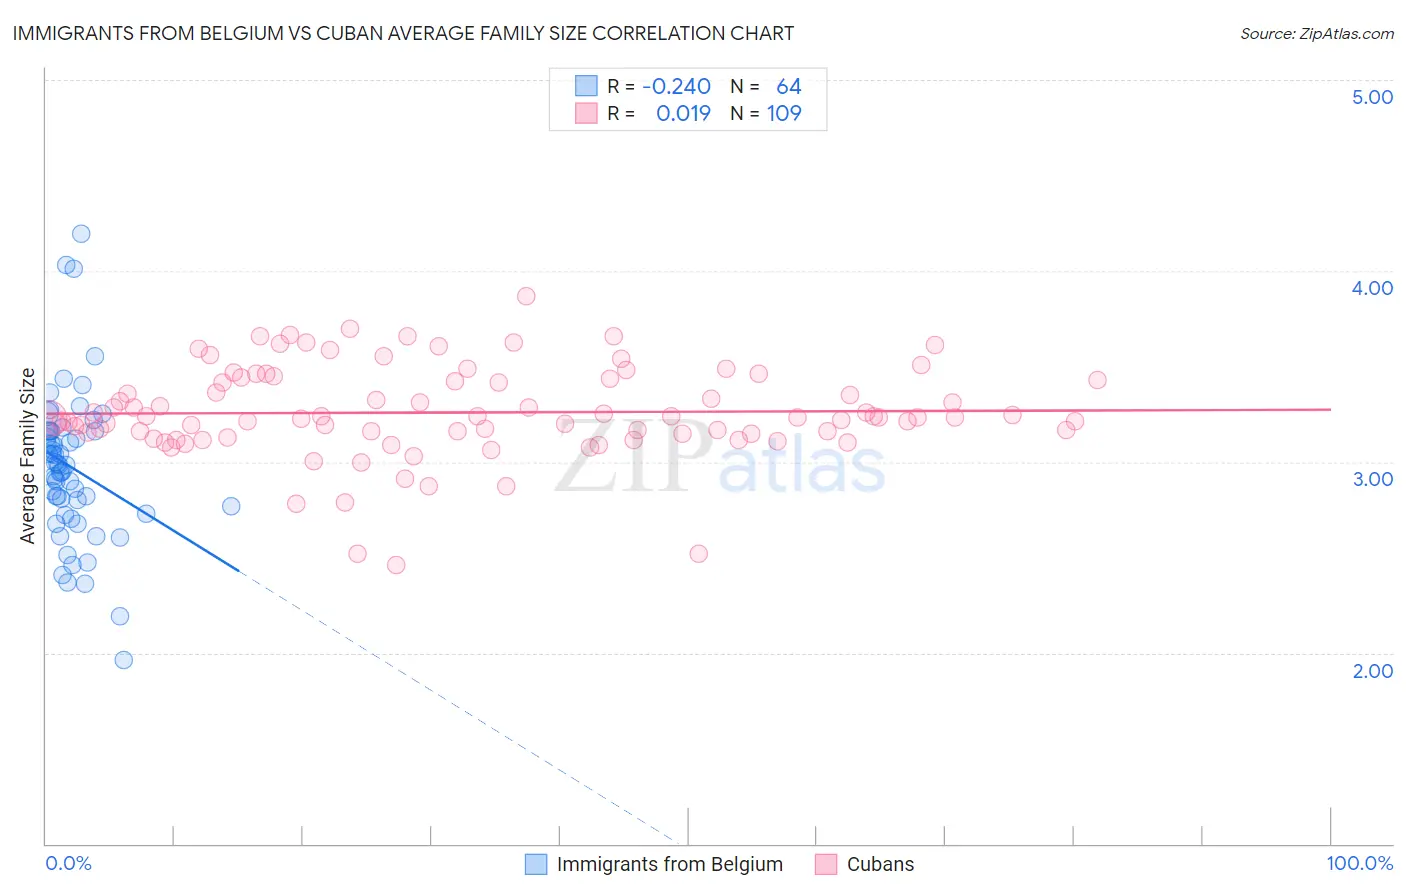
Immigrants from Belgium vs Cuban Average Family Size Correlation Chart
The statistical analysis conducted on geographies consisting of 146,697,928 people shows a weak negative correlation between the proportion of Immigrants from Belgium and average family size in the United States with a correlation coefficient (R) of -0.240 and weighted average of 3.15. Similarly, the statistical analysis conducted on geographies consisting of 448,974,535 people shows no correlation between the proportion of Cubans and average family size in the United States with a correlation coefficient (R) of 0.019 and weighted average of 3.25, a difference of 3.1%.
Average Family Size Correlation Summary
| Measurement | Immigrants from Belgium | Cuban |
| Minimum | 1.96 | 2.46 |
| Maximum | 4.19 | 3.87 |
| Range | 2.23 | 1.41 |
| Mean | 2.97 | 3.26 |
| Median | 2.98 | 3.23 |
| Interquartile 25% (IQ1) | 2.75 | 3.15 |
| Interquartile 75% (IQ3) | 3.16 | 3.43 |
| Interquartile Range (IQR) | 0.41 | 0.28 |
| Standard Deviation (Sample) | 0.39 | 0.24 |
| Standard Deviation (Population) | 0.39 | 0.24 |
Similar Demographics by Average Family Size
Demographics Similar to Immigrants from Belgium by Average Family Size
In terms of average family size, the demographic groups most similar to Immigrants from Belgium are New Zealander (3.15, a difference of 0.0%), Cambodian (3.15, a difference of 0.0%), Immigrants from Lithuania (3.15, a difference of 0.020%), Immigrants from Germany (3.15, a difference of 0.030%), and Tlingit-Haida (3.16, a difference of 0.060%).
| Demographics | Rating | Rank | Average Family Size |
| Iroquois | 0.8 /100 | #267 | Tragic 3.16 |
| Maltese | 0.8 /100 | #268 | Tragic 3.16 |
| Immigrants | Singapore | 0.7 /100 | #269 | Tragic 3.16 |
| Tlingit-Haida | 0.7 /100 | #270 | Tragic 3.16 |
| Immigrants | Germany | 0.7 /100 | #271 | Tragic 3.15 |
| Immigrants | Lithuania | 0.6 /100 | #272 | Tragic 3.15 |
| New Zealanders | 0.6 /100 | #273 | Tragic 3.15 |
| Immigrants | Belgium | 0.6 /100 | #274 | Tragic 3.15 |
| Cambodians | 0.6 /100 | #275 | Tragic 3.15 |
| Immigrants | Bosnia and Herzegovina | 0.5 /100 | #276 | Tragic 3.15 |
| Swiss | 0.5 /100 | #277 | Tragic 3.15 |
| Okinawans | 0.5 /100 | #278 | Tragic 3.15 |
| Immigrants | Europe | 0.5 /100 | #279 | Tragic 3.15 |
| Immigrants | England | 0.4 /100 | #280 | Tragic 3.15 |
| Immigrants | Denmark | 0.4 /100 | #281 | Tragic 3.15 |
Demographics Similar to Cubans by Average Family Size
In terms of average family size, the demographic groups most similar to Cubans are Immigrants from Ethiopia (3.25, a difference of 0.010%), Subsaharan African (3.25, a difference of 0.010%), Venezuelan (3.25, a difference of 0.010%), Immigrants from Middle Africa (3.25, a difference of 0.020%), and Liberian (3.25, a difference of 0.020%).
| Demographics | Rating | Rank | Average Family Size |
| Immigrants | Western Asia | 87.7 /100 | #131 | Excellent 3.26 |
| Costa Ricans | 86.8 /100 | #132 | Excellent 3.26 |
| Immigrants | Venezuela | 86.3 /100 | #133 | Excellent 3.26 |
| Africans | 84.9 /100 | #134 | Excellent 3.25 |
| Panamanians | 84.2 /100 | #135 | Excellent 3.25 |
| Comanche | 82.8 /100 | #136 | Excellent 3.25 |
| Immigrants | Middle Africa | 82.4 /100 | #137 | Excellent 3.25 |
| Cubans | 81.8 /100 | #138 | Excellent 3.25 |
| Immigrants | Ethiopia | 81.6 /100 | #139 | Excellent 3.25 |
| Sub-Saharan Africans | 81.6 /100 | #140 | Excellent 3.25 |
| Venezuelans | 81.4 /100 | #141 | Excellent 3.25 |
| Liberians | 81.2 /100 | #142 | Excellent 3.25 |
| Bhutanese | 81.0 /100 | #143 | Excellent 3.25 |
| Tsimshian | 80.2 /100 | #144 | Excellent 3.25 |
| Armenians | 78.2 /100 | #145 | Good 3.25 |