Northern European vs Native/Alaskan Family Households
COMPARE
Northern European
Native/Alaskan
Family Households
Family Households Comparison
Northern Europeans
Natives/Alaskans
64.1%
FAMILY HOUSEHOLDS
28.2/ 100
METRIC RATING
187th/ 347
METRIC RANK
66.4%
FAMILY HOUSEHOLDS
100.0/ 100
METRIC RATING
51st/ 347
METRIC RANK
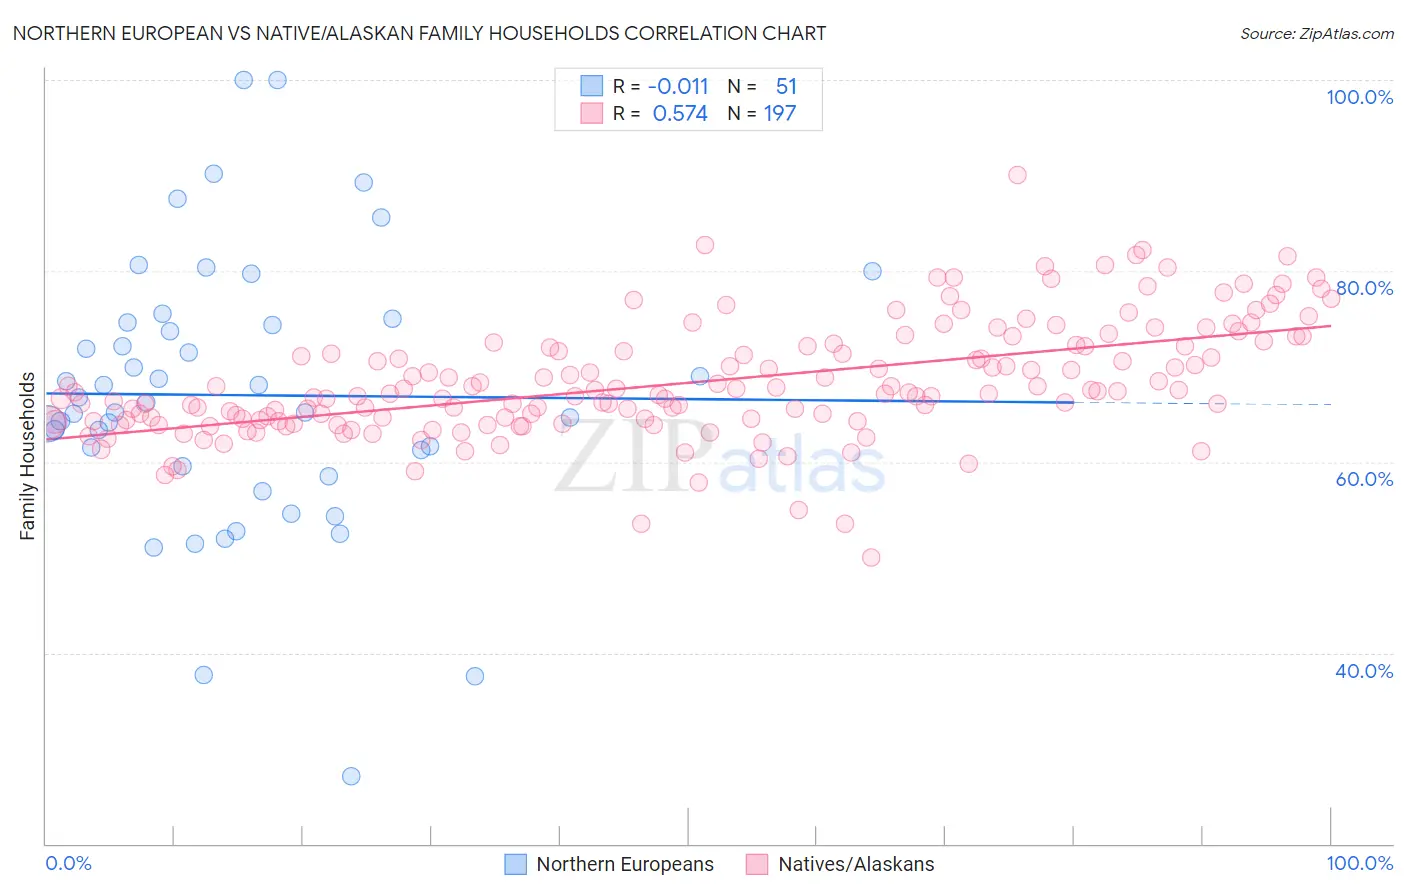
Northern European vs Native/Alaskan Family Households Correlation Chart
The statistical analysis conducted on geographies consisting of 405,947,196 people shows no correlation between the proportion of Northern Europeans and percentage of family households in the United States with a correlation coefficient (R) of -0.011 and weighted average of 64.1%. Similarly, the statistical analysis conducted on geographies consisting of 512,654,863 people shows a substantial positive correlation between the proportion of Natives/Alaskans and percentage of family households in the United States with a correlation coefficient (R) of 0.574 and weighted average of 66.4%, a difference of 3.5%.
Family Households Correlation Summary
| Measurement | Northern European | Native/Alaskan |
| Minimum | 27.1% | 49.9% |
| Maximum | 100.0% | 90.0% |
| Range | 72.9% | 40.1% |
| Mean | 67.0% | 68.3% |
| Median | 66.2% | 67.2% |
| Interquartile 25% (IQ1) | 59.5% | 64.2% |
| Interquartile 75% (IQ3) | 74.7% | 72.1% |
| Interquartile Range (IQR) | 15.1% | 7.9% |
| Standard Deviation (Sample) | 14.3% | 6.0% |
| Standard Deviation (Population) | 14.2% | 6.0% |
Similar Demographics by Family Households
Demographics Similar to Northern Europeans by Family Households
In terms of family households, the demographic groups most similar to Northern Europeans are Spanish American (64.1%, a difference of 0.030%), Paraguayan (64.1%, a difference of 0.030%), Immigrants from Iran (64.1%, a difference of 0.040%), Immigrants from Western Asia (64.1%, a difference of 0.050%), and Zimbabwean (64.1%, a difference of 0.060%).
| Demographics | Rating | Rank | Family Households |
| Immigrants | Honduras | 35.0 /100 | #180 | Fair 64.2% |
| Immigrants | Trinidad and Tobago | 34.9 /100 | #181 | Fair 64.2% |
| Ukrainians | 34.6 /100 | #182 | Fair 64.2% |
| Creek | 34.1 /100 | #183 | Fair 64.2% |
| Puerto Ricans | 33.4 /100 | #184 | Fair 64.2% |
| Immigrants | Iran | 30.4 /100 | #185 | Fair 64.1% |
| Spanish Americans | 30.1 /100 | #186 | Fair 64.1% |
| Northern Europeans | 28.2 /100 | #187 | Fair 64.1% |
| Paraguayans | 26.7 /100 | #188 | Fair 64.1% |
| Immigrants | Western Asia | 25.3 /100 | #189 | Fair 64.1% |
| Zimbabweans | 24.7 /100 | #190 | Fair 64.1% |
| Arabs | 24.5 /100 | #191 | Fair 64.1% |
| Lithuanians | 23.8 /100 | #192 | Fair 64.0% |
| French | 23.7 /100 | #193 | Fair 64.0% |
| Paiute | 22.2 /100 | #194 | Fair 64.0% |
Demographics Similar to Natives/Alaskans by Family Households
In terms of family households, the demographic groups most similar to Natives/Alaskans are Navajo (66.4%, a difference of 0.030%), Immigrants from South Central Asia (66.4%, a difference of 0.090%), Immigrants from Venezuela (66.4%, a difference of 0.14%), Colombian (66.3%, a difference of 0.14%), and Afghan (66.3%, a difference of 0.14%).
| Demographics | Rating | Rank | Family Households |
| Asians | 100.0 /100 | #44 | Exceptional 66.5% |
| Venezuelans | 100.0 /100 | #45 | Exceptional 66.5% |
| Arapaho | 100.0 /100 | #46 | Exceptional 66.5% |
| Bolivians | 100.0 /100 | #47 | Exceptional 66.5% |
| Immigrants | Venezuela | 100.0 /100 | #48 | Exceptional 66.4% |
| Immigrants | South Central Asia | 100.0 /100 | #49 | Exceptional 66.4% |
| Navajo | 100.0 /100 | #50 | Exceptional 66.4% |
| Natives/Alaskans | 100.0 /100 | #51 | Exceptional 66.4% |
| Colombians | 100.0 /100 | #52 | Exceptional 66.3% |
| Afghans | 100.0 /100 | #53 | Exceptional 66.3% |
| Immigrants | Colombia | 100.0 /100 | #54 | Exceptional 66.3% |
| Immigrants | Immigrants | 100.0 /100 | #55 | Exceptional 66.1% |
| Immigrants | Hong Kong | 100.0 /100 | #56 | Exceptional 66.1% |
| Pennsylvania Germans | 100.0 /100 | #57 | Exceptional 66.1% |
| Immigrants | Asia | 100.0 /100 | #58 | Exceptional 66.1% |