Northern European vs Ethiopian Divorced or Separated
COMPARE
Northern European
Ethiopian
Divorced or Separated
Divorced or Separated Comparison
Northern Europeans
Ethiopians
12.2%
DIVORCED OR SEPARATED
14.7/ 100
METRIC RATING
217th/ 347
METRIC RANK
12.0%
DIVORCED OR SEPARATED
58.5/ 100
METRIC RATING
167th/ 347
METRIC RANK
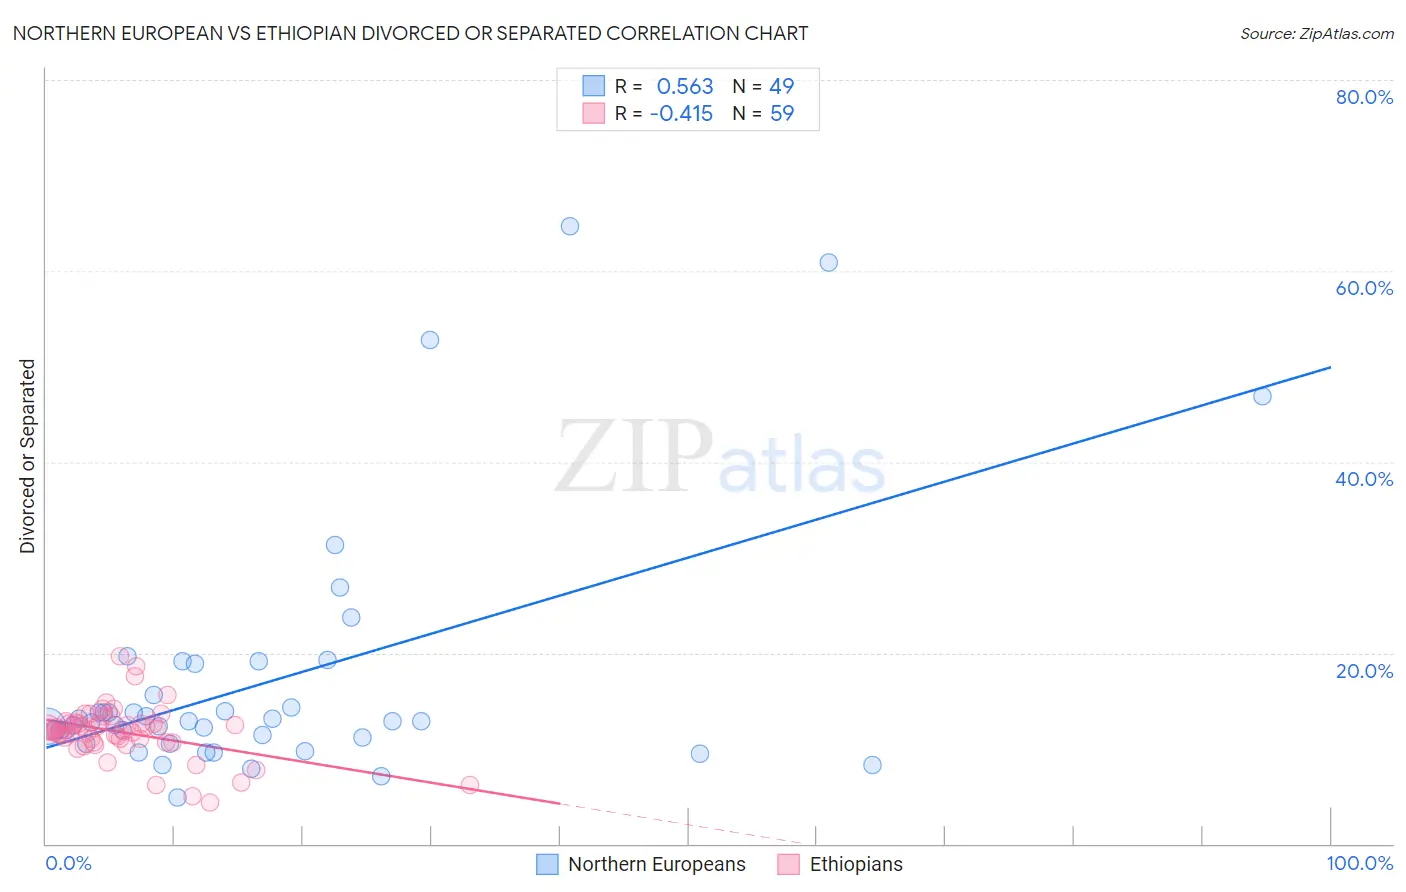
Northern European vs Ethiopian Divorced or Separated Correlation Chart
The statistical analysis conducted on geographies consisting of 405,985,696 people shows a substantial positive correlation between the proportion of Northern Europeans and percentage of population currently divorced or separated in the United States with a correlation coefficient (R) of 0.563 and weighted average of 12.2%. Similarly, the statistical analysis conducted on geographies consisting of 223,166,328 people shows a moderate negative correlation between the proportion of Ethiopians and percentage of population currently divorced or separated in the United States with a correlation coefficient (R) of -0.415 and weighted average of 12.0%, a difference of 1.8%.
Divorced or Separated Correlation Summary
| Measurement | Northern European | Ethiopian |
| Minimum | 4.9% | 4.3% |
| Maximum | 64.7% | 19.7% |
| Range | 59.8% | 15.4% |
| Mean | 16.9% | 11.7% |
| Median | 12.8% | 11.8% |
| Interquartile 25% (IQ1) | 10.8% | 10.7% |
| Interquartile 75% (IQ3) | 17.2% | 12.6% |
| Interquartile Range (IQR) | 6.4% | 1.9% |
| Standard Deviation (Sample) | 12.9% | 2.8% |
| Standard Deviation (Population) | 12.8% | 2.8% |
Similar Demographics by Divorced or Separated
Demographics Similar to Northern Europeans by Divorced or Separated
In terms of divorced or separated, the demographic groups most similar to Northern Europeans are Immigrants from South America (12.2%, a difference of 0.040%), Immigrants from Argentina (12.2%, a difference of 0.050%), European (12.2%, a difference of 0.050%), Immigrants from Eastern Africa (12.2%, a difference of 0.10%), and Slovene (12.3%, a difference of 0.11%).
| Demographics | Rating | Rank | Divorced or Separated |
| Slavs | 17.0 /100 | #210 | Poor 12.2% |
| Trinidadians and Tobagonians | 16.6 /100 | #211 | Poor 12.2% |
| Immigrants | Kenya | 16.5 /100 | #212 | Poor 12.2% |
| Immigrants | Eastern Africa | 16.2 /100 | #213 | Poor 12.2% |
| Immigrants | Argentina | 15.5 /100 | #214 | Poor 12.2% |
| Europeans | 15.4 /100 | #215 | Poor 12.2% |
| Immigrants | South America | 15.4 /100 | #216 | Poor 12.2% |
| Northern Europeans | 14.7 /100 | #217 | Poor 12.2% |
| Slovenes | 13.2 /100 | #218 | Poor 12.3% |
| Czechoslovakians | 11.7 /100 | #219 | Poor 12.3% |
| British | 11.6 /100 | #220 | Poor 12.3% |
| Guamanians/Chamorros | 11.3 /100 | #221 | Poor 12.3% |
| Bangladeshis | 10.5 /100 | #222 | Poor 12.3% |
| Scandinavians | 10.4 /100 | #223 | Poor 12.3% |
| Immigrants | Azores | 9.7 /100 | #224 | Tragic 12.3% |
Demographics Similar to Ethiopians by Divorced or Separated
In terms of divorced or separated, the demographic groups most similar to Ethiopians are Serbian (12.0%, a difference of 0.050%), Immigrants from Peru (12.0%, a difference of 0.050%), Tohono O'odham (12.0%, a difference of 0.070%), Mexican American Indian (12.0%, a difference of 0.10%), and German Russian (12.0%, a difference of 0.12%).
| Demographics | Rating | Rank | Divorced or Separated |
| Immigrants | Scotland | 65.8 /100 | #160 | Good 12.0% |
| Marshallese | 64.6 /100 | #161 | Good 12.0% |
| Samoans | 64.3 /100 | #162 | Good 12.0% |
| Navajo | 63.9 /100 | #163 | Good 12.0% |
| Swiss | 63.6 /100 | #164 | Good 12.0% |
| German Russians | 61.8 /100 | #165 | Good 12.0% |
| Tohono O'odham | 60.4 /100 | #166 | Good 12.0% |
| Ethiopians | 58.5 /100 | #167 | Average 12.0% |
| Serbians | 57.1 /100 | #168 | Average 12.0% |
| Immigrants | Peru | 57.0 /100 | #169 | Average 12.0% |
| Mexican American Indians | 55.8 /100 | #170 | Average 12.0% |
| Costa Ricans | 53.3 /100 | #171 | Average 12.0% |
| Immigrants | Mexico | 53.2 /100 | #172 | Average 12.0% |
| Immigrants | Moldova | 50.4 /100 | #173 | Average 12.1% |
| Hawaiians | 50.0 /100 | #174 | Average 12.1% |