Immigrants from Russia vs Ethiopian Divorced or Separated
COMPARE
Immigrants from Russia
Ethiopian
Divorced or Separated
Divorced or Separated Comparison
Immigrants from Russia
Ethiopians
11.3%
DIVORCED OR SEPARATED
99.9/ 100
METRIC RATING
60th/ 347
METRIC RANK
12.0%
DIVORCED OR SEPARATED
58.5/ 100
METRIC RATING
167th/ 347
METRIC RANK
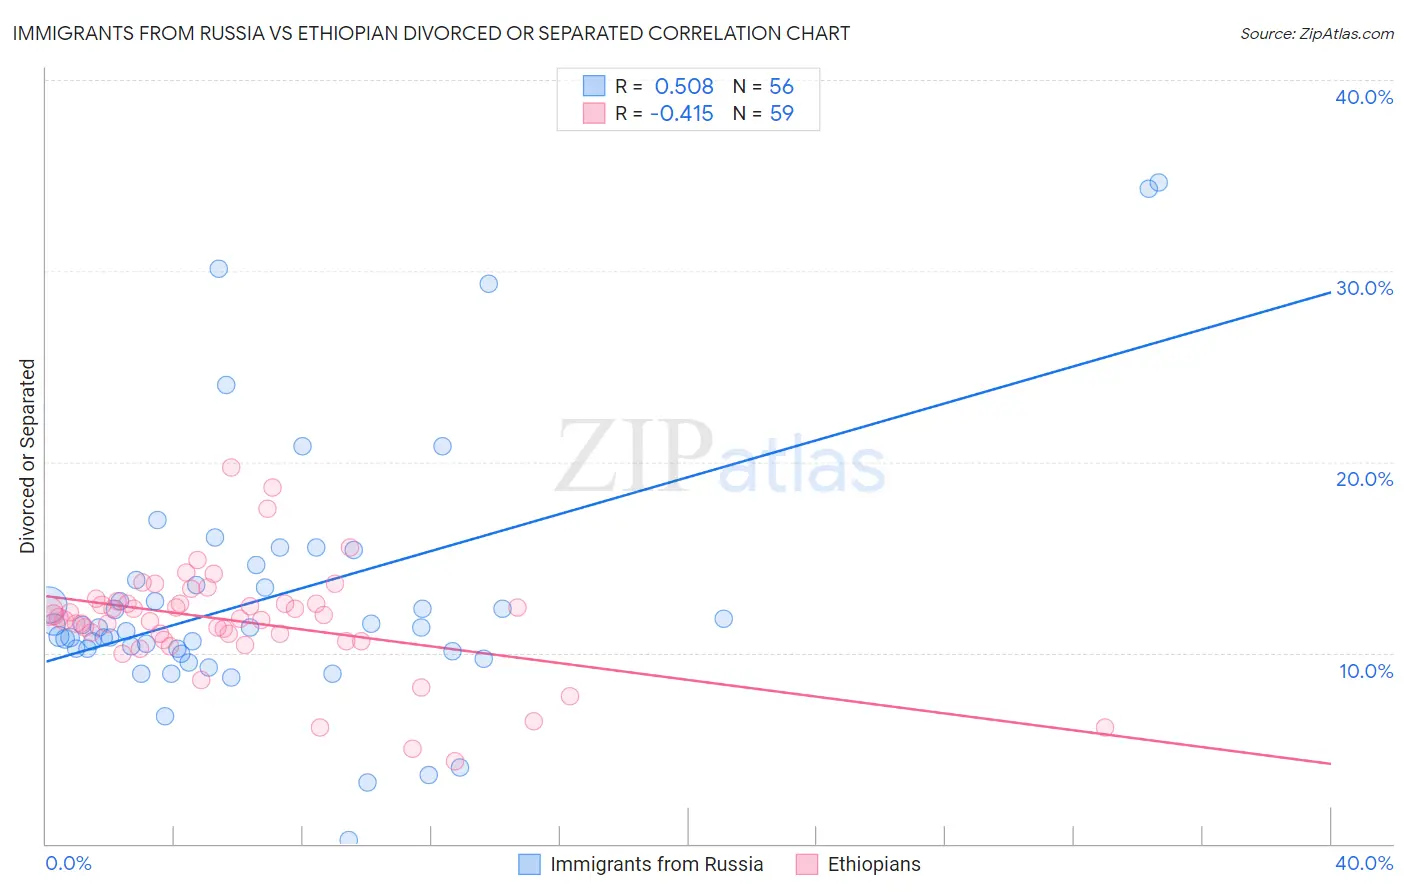
Immigrants from Russia vs Ethiopian Divorced or Separated Correlation Chart
The statistical analysis conducted on geographies consisting of 347,782,642 people shows a substantial positive correlation between the proportion of Immigrants from Russia and percentage of population currently divorced or separated in the United States with a correlation coefficient (R) of 0.508 and weighted average of 11.3%. Similarly, the statistical analysis conducted on geographies consisting of 223,166,328 people shows a moderate negative correlation between the proportion of Ethiopians and percentage of population currently divorced or separated in the United States with a correlation coefficient (R) of -0.415 and weighted average of 12.0%, a difference of 5.9%.
Divorced or Separated Correlation Summary
| Measurement | Immigrants from Russia | Ethiopian |
| Minimum | 0.20% | 4.3% |
| Maximum | 34.6% | 19.7% |
| Range | 34.4% | 15.4% |
| Mean | 12.9% | 11.7% |
| Median | 11.3% | 11.8% |
| Interquartile 25% (IQ1) | 10.1% | 10.7% |
| Interquartile 75% (IQ3) | 13.7% | 12.6% |
| Interquartile Range (IQR) | 3.5% | 1.9% |
| Standard Deviation (Sample) | 6.7% | 2.8% |
| Standard Deviation (Population) | 6.6% | 2.8% |
Similar Demographics by Divorced or Separated
Demographics Similar to Immigrants from Russia by Divorced or Separated
In terms of divorced or separated, the demographic groups most similar to Immigrants from Russia are Korean (11.3%, a difference of 0.010%), Luxembourger (11.3%, a difference of 0.010%), Immigrants from Kuwait (11.3%, a difference of 0.020%), Israeli (11.3%, a difference of 0.16%), and Sri Lankan (11.3%, a difference of 0.26%).
| Demographics | Rating | Rank | Divorced or Separated |
| Immigrants | Lithuania | 99.9 /100 | #53 | Exceptional 11.3% |
| Eastern Europeans | 99.9 /100 | #54 | Exceptional 11.3% |
| Immigrants | Yemen | 99.9 /100 | #55 | Exceptional 11.3% |
| Immigrants | Philippines | 99.9 /100 | #56 | Exceptional 11.3% |
| Immigrants | Vietnam | 99.9 /100 | #57 | Exceptional 11.3% |
| Sri Lankans | 99.9 /100 | #58 | Exceptional 11.3% |
| Israelis | 99.9 /100 | #59 | Exceptional 11.3% |
| Immigrants | Russia | 99.9 /100 | #60 | Exceptional 11.3% |
| Koreans | 99.9 /100 | #61 | Exceptional 11.3% |
| Luxembourgers | 99.9 /100 | #62 | Exceptional 11.3% |
| Immigrants | Kuwait | 99.9 /100 | #63 | Exceptional 11.3% |
| Macedonians | 99.8 /100 | #64 | Exceptional 11.4% |
| Immigrants | South Eastern Asia | 99.8 /100 | #65 | Exceptional 11.4% |
| Inupiat | 99.8 /100 | #66 | Exceptional 11.4% |
| Immigrants | Syria | 99.7 /100 | #67 | Exceptional 11.4% |
Demographics Similar to Ethiopians by Divorced or Separated
In terms of divorced or separated, the demographic groups most similar to Ethiopians are Serbian (12.0%, a difference of 0.050%), Immigrants from Peru (12.0%, a difference of 0.050%), Tohono O'odham (12.0%, a difference of 0.070%), Mexican American Indian (12.0%, a difference of 0.10%), and German Russian (12.0%, a difference of 0.12%).
| Demographics | Rating | Rank | Divorced or Separated |
| Immigrants | Scotland | 65.8 /100 | #160 | Good 12.0% |
| Marshallese | 64.6 /100 | #161 | Good 12.0% |
| Samoans | 64.3 /100 | #162 | Good 12.0% |
| Navajo | 63.9 /100 | #163 | Good 12.0% |
| Swiss | 63.6 /100 | #164 | Good 12.0% |
| German Russians | 61.8 /100 | #165 | Good 12.0% |
| Tohono O'odham | 60.4 /100 | #166 | Good 12.0% |
| Ethiopians | 58.5 /100 | #167 | Average 12.0% |
| Serbians | 57.1 /100 | #168 | Average 12.0% |
| Immigrants | Peru | 57.0 /100 | #169 | Average 12.0% |
| Mexican American Indians | 55.8 /100 | #170 | Average 12.0% |
| Costa Ricans | 53.3 /100 | #171 | Average 12.0% |
| Immigrants | Mexico | 53.2 /100 | #172 | Average 12.0% |
| Immigrants | Moldova | 50.4 /100 | #173 | Average 12.1% |
| Hawaiians | 50.0 /100 | #174 | Average 12.1% |