Immigrants from Northern Europe vs Ethiopian Divorced or Separated
COMPARE
Immigrants from Northern Europe
Ethiopian
Divorced or Separated
Divorced or Separated Comparison
Immigrants from Northern Europe
Ethiopians
11.6%
DIVORCED OR SEPARATED
98.6/ 100
METRIC RATING
100th/ 347
METRIC RANK
12.0%
DIVORCED OR SEPARATED
58.5/ 100
METRIC RATING
167th/ 347
METRIC RANK
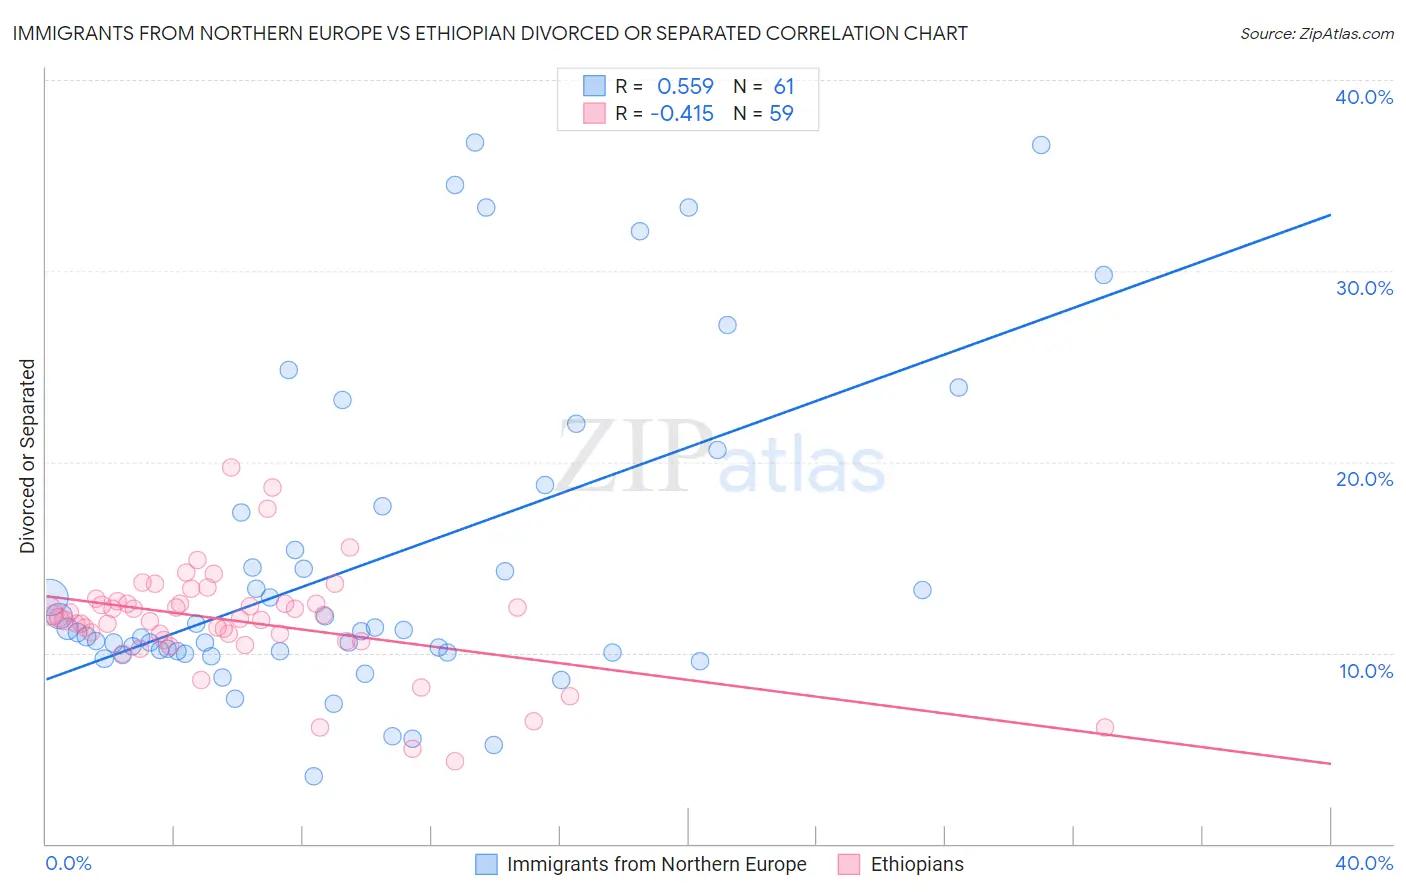
Immigrants from Northern Europe vs Ethiopian Divorced or Separated Correlation Chart
The statistical analysis conducted on geographies consisting of 477,042,338 people shows a substantial positive correlation between the proportion of Immigrants from Northern Europe and percentage of population currently divorced or separated in the United States with a correlation coefficient (R) of 0.559 and weighted average of 11.6%. Similarly, the statistical analysis conducted on geographies consisting of 223,166,328 people shows a moderate negative correlation between the proportion of Ethiopians and percentage of population currently divorced or separated in the United States with a correlation coefficient (R) of -0.415 and weighted average of 12.0%, a difference of 3.5%.
Divorced or Separated Correlation Summary
| Measurement | Immigrants from Northern Europe | Ethiopian |
| Minimum | 3.5% | 4.3% |
| Maximum | 36.7% | 19.7% |
| Range | 33.2% | 15.4% |
| Mean | 14.7% | 11.7% |
| Median | 11.1% | 11.8% |
| Interquartile 25% (IQ1) | 10.0% | 10.7% |
| Interquartile 75% (IQ3) | 17.5% | 12.6% |
| Interquartile Range (IQR) | 7.5% | 1.9% |
| Standard Deviation (Sample) | 8.4% | 2.8% |
| Standard Deviation (Population) | 8.3% | 2.8% |
Similar Demographics by Divorced or Separated
Demographics Similar to Immigrants from Northern Europe by Divorced or Separated
In terms of divorced or separated, the demographic groups most similar to Immigrants from Northern Europe are Immigrants from Sweden (11.6%, a difference of 0.030%), Immigrants from Guyana (11.6%, a difference of 0.030%), Immigrants from Jordan (11.6%, a difference of 0.050%), Latvian (11.6%, a difference of 0.090%), and Immigrants from Ukraine (11.6%, a difference of 0.11%).
| Demographics | Rating | Rank | Divorced or Separated |
| Arabs | 98.9 /100 | #93 | Exceptional 11.6% |
| Immigrants | Fiji | 98.9 /100 | #94 | Exceptional 11.6% |
| Immigrants | Serbia | 98.8 /100 | #95 | Exceptional 11.6% |
| Immigrants | Ukraine | 98.7 /100 | #96 | Exceptional 11.6% |
| Latvians | 98.7 /100 | #97 | Exceptional 11.6% |
| Immigrants | Jordan | 98.6 /100 | #98 | Exceptional 11.6% |
| Immigrants | Sweden | 98.6 /100 | #99 | Exceptional 11.6% |
| Immigrants | Northern Europe | 98.6 /100 | #100 | Exceptional 11.6% |
| Immigrants | Guyana | 98.5 /100 | #101 | Exceptional 11.6% |
| Immigrants | Croatia | 98.3 /100 | #102 | Exceptional 11.6% |
| Maltese | 98.2 /100 | #103 | Exceptional 11.6% |
| Salvadorans | 98.2 /100 | #104 | Exceptional 11.6% |
| Immigrants | El Salvador | 97.9 /100 | #105 | Exceptional 11.7% |
| Immigrants | Kazakhstan | 97.8 /100 | #106 | Exceptional 11.7% |
| Native Hawaiians | 97.2 /100 | #107 | Exceptional 11.7% |
Demographics Similar to Ethiopians by Divorced or Separated
In terms of divorced or separated, the demographic groups most similar to Ethiopians are Serbian (12.0%, a difference of 0.050%), Immigrants from Peru (12.0%, a difference of 0.050%), Tohono O'odham (12.0%, a difference of 0.070%), Mexican American Indian (12.0%, a difference of 0.10%), and German Russian (12.0%, a difference of 0.12%).
| Demographics | Rating | Rank | Divorced or Separated |
| Immigrants | Scotland | 65.8 /100 | #160 | Good 12.0% |
| Marshallese | 64.6 /100 | #161 | Good 12.0% |
| Samoans | 64.3 /100 | #162 | Good 12.0% |
| Navajo | 63.9 /100 | #163 | Good 12.0% |
| Swiss | 63.6 /100 | #164 | Good 12.0% |
| German Russians | 61.8 /100 | #165 | Good 12.0% |
| Tohono O'odham | 60.4 /100 | #166 | Good 12.0% |
| Ethiopians | 58.5 /100 | #167 | Average 12.0% |
| Serbians | 57.1 /100 | #168 | Average 12.0% |
| Immigrants | Peru | 57.0 /100 | #169 | Average 12.0% |
| Mexican American Indians | 55.8 /100 | #170 | Average 12.0% |
| Costa Ricans | 53.3 /100 | #171 | Average 12.0% |
| Immigrants | Mexico | 53.2 /100 | #172 | Average 12.0% |
| Immigrants | Moldova | 50.4 /100 | #173 | Average 12.1% |
| Hawaiians | 50.0 /100 | #174 | Average 12.1% |