Immigrants from Cameroon vs Ethiopian Divorced or Separated
COMPARE
Immigrants from Cameroon
Ethiopian
Divorced or Separated
Divorced or Separated Comparison
Immigrants from Cameroon
Ethiopians
12.3%
DIVORCED OR SEPARATED
8.3/ 100
METRIC RATING
228th/ 347
METRIC RANK
12.0%
DIVORCED OR SEPARATED
58.5/ 100
METRIC RATING
167th/ 347
METRIC RANK
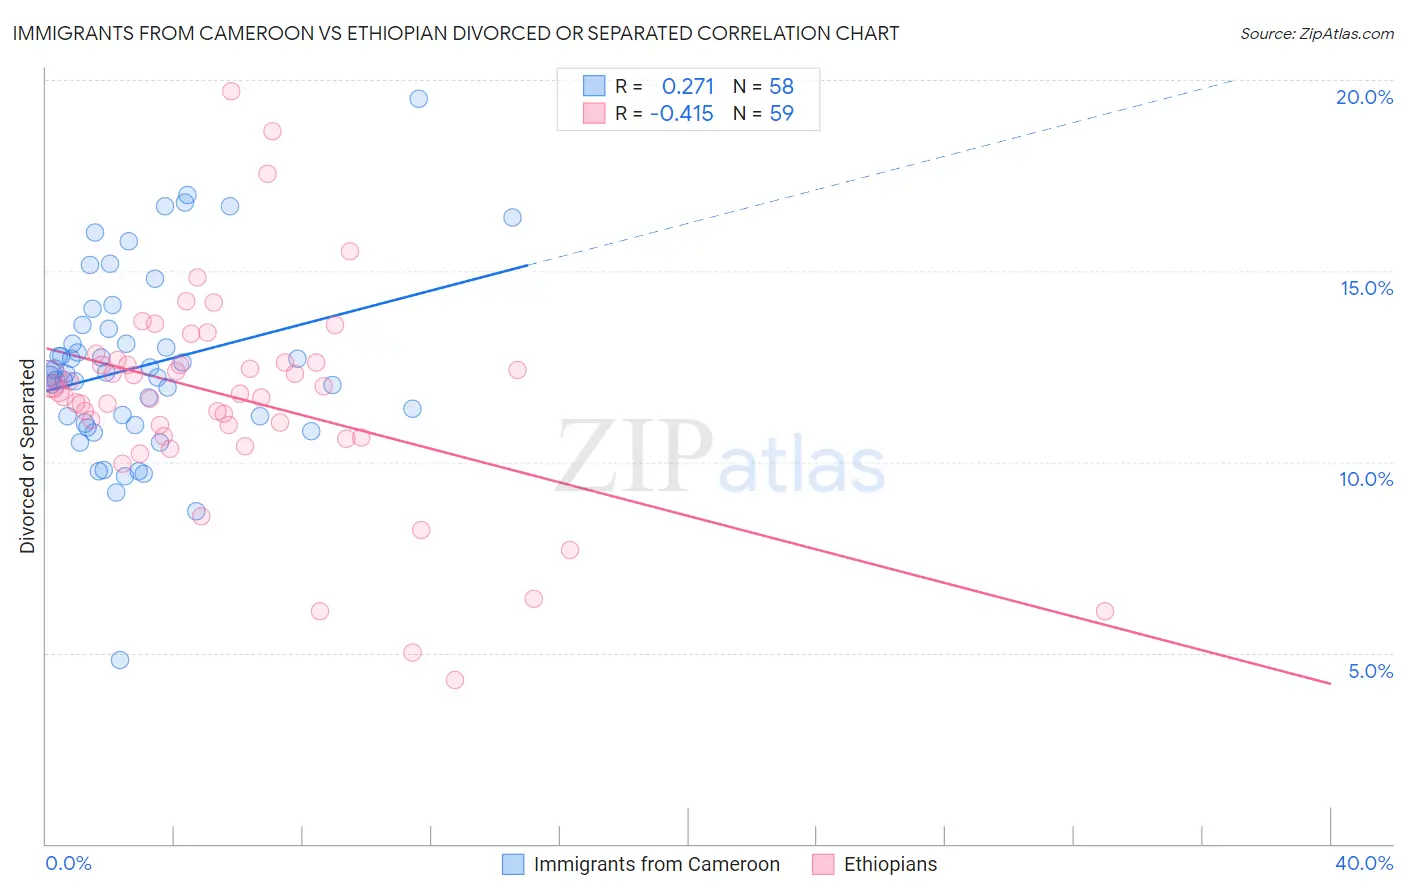
Immigrants from Cameroon vs Ethiopian Divorced or Separated Correlation Chart
The statistical analysis conducted on geographies consisting of 130,744,662 people shows a weak positive correlation between the proportion of Immigrants from Cameroon and percentage of population currently divorced or separated in the United States with a correlation coefficient (R) of 0.271 and weighted average of 12.3%. Similarly, the statistical analysis conducted on geographies consisting of 223,166,328 people shows a moderate negative correlation between the proportion of Ethiopians and percentage of population currently divorced or separated in the United States with a correlation coefficient (R) of -0.415 and weighted average of 12.0%, a difference of 2.4%.
Divorced or Separated Correlation Summary
| Measurement | Immigrants from Cameroon | Ethiopian |
| Minimum | 4.8% | 4.3% |
| Maximum | 19.5% | 19.7% |
| Range | 14.7% | 15.4% |
| Mean | 12.5% | 11.7% |
| Median | 12.3% | 11.8% |
| Interquartile 25% (IQ1) | 11.0% | 10.7% |
| Interquartile 75% (IQ3) | 13.5% | 12.6% |
| Interquartile Range (IQR) | 2.5% | 1.9% |
| Standard Deviation (Sample) | 2.4% | 2.8% |
| Standard Deviation (Population) | 2.4% | 2.8% |
Similar Demographics by Divorced or Separated
Demographics Similar to Immigrants from Cameroon by Divorced or Separated
In terms of divorced or separated, the demographic groups most similar to Immigrants from Cameroon are Immigrants from Sudan (12.3%, a difference of 0.020%), Hmong (12.3%, a difference of 0.050%), Yakama (12.3%, a difference of 0.060%), Immigrants from Western Africa (12.3%, a difference of 0.10%), and Immigrants from the Azores (12.3%, a difference of 0.14%).
| Demographics | Rating | Rank | Divorced or Separated |
| Guamanians/Chamorros | 11.3 /100 | #221 | Poor 12.3% |
| Bangladeshis | 10.5 /100 | #222 | Poor 12.3% |
| Scandinavians | 10.4 /100 | #223 | Poor 12.3% |
| Immigrants | Azores | 9.7 /100 | #224 | Tragic 12.3% |
| Belgians | 9.7 /100 | #225 | Tragic 12.3% |
| Immigrants | Western Africa | 9.3 /100 | #226 | Tragic 12.3% |
| Hmong | 8.8 /100 | #227 | Tragic 12.3% |
| Immigrants | Cameroon | 8.3 /100 | #228 | Tragic 12.3% |
| Immigrants | Sudan | 8.2 /100 | #229 | Tragic 12.3% |
| Yakama | 7.8 /100 | #230 | Tragic 12.3% |
| Yugoslavians | 6.6 /100 | #231 | Tragic 12.3% |
| Canadians | 5.3 /100 | #232 | Tragic 12.4% |
| Malaysians | 4.8 /100 | #233 | Tragic 12.4% |
| West Indians | 4.4 /100 | #234 | Tragic 12.4% |
| Immigrants | Bosnia and Herzegovina | 4.3 /100 | #235 | Tragic 12.4% |
Demographics Similar to Ethiopians by Divorced or Separated
In terms of divorced or separated, the demographic groups most similar to Ethiopians are Serbian (12.0%, a difference of 0.050%), Immigrants from Peru (12.0%, a difference of 0.050%), Tohono O'odham (12.0%, a difference of 0.070%), Mexican American Indian (12.0%, a difference of 0.10%), and German Russian (12.0%, a difference of 0.12%).
| Demographics | Rating | Rank | Divorced or Separated |
| Immigrants | Scotland | 65.8 /100 | #160 | Good 12.0% |
| Marshallese | 64.6 /100 | #161 | Good 12.0% |
| Samoans | 64.3 /100 | #162 | Good 12.0% |
| Navajo | 63.9 /100 | #163 | Good 12.0% |
| Swiss | 63.6 /100 | #164 | Good 12.0% |
| German Russians | 61.8 /100 | #165 | Good 12.0% |
| Tohono O'odham | 60.4 /100 | #166 | Good 12.0% |
| Ethiopians | 58.5 /100 | #167 | Average 12.0% |
| Serbians | 57.1 /100 | #168 | Average 12.0% |
| Immigrants | Peru | 57.0 /100 | #169 | Average 12.0% |
| Mexican American Indians | 55.8 /100 | #170 | Average 12.0% |
| Costa Ricans | 53.3 /100 | #171 | Average 12.0% |
| Immigrants | Mexico | 53.2 /100 | #172 | Average 12.0% |
| Immigrants | Moldova | 50.4 /100 | #173 | Average 12.1% |
| Hawaiians | 50.0 /100 | #174 | Average 12.1% |