New Zealander vs Ethiopian Divorced or Separated
COMPARE
New Zealander
Ethiopian
Divorced or Separated
Divorced or Separated Comparison
New Zealanders
Ethiopians
11.9%
DIVORCED OR SEPARATED
87.5/ 100
METRIC RATING
133rd/ 347
METRIC RANK
12.0%
DIVORCED OR SEPARATED
58.5/ 100
METRIC RATING
167th/ 347
METRIC RANK
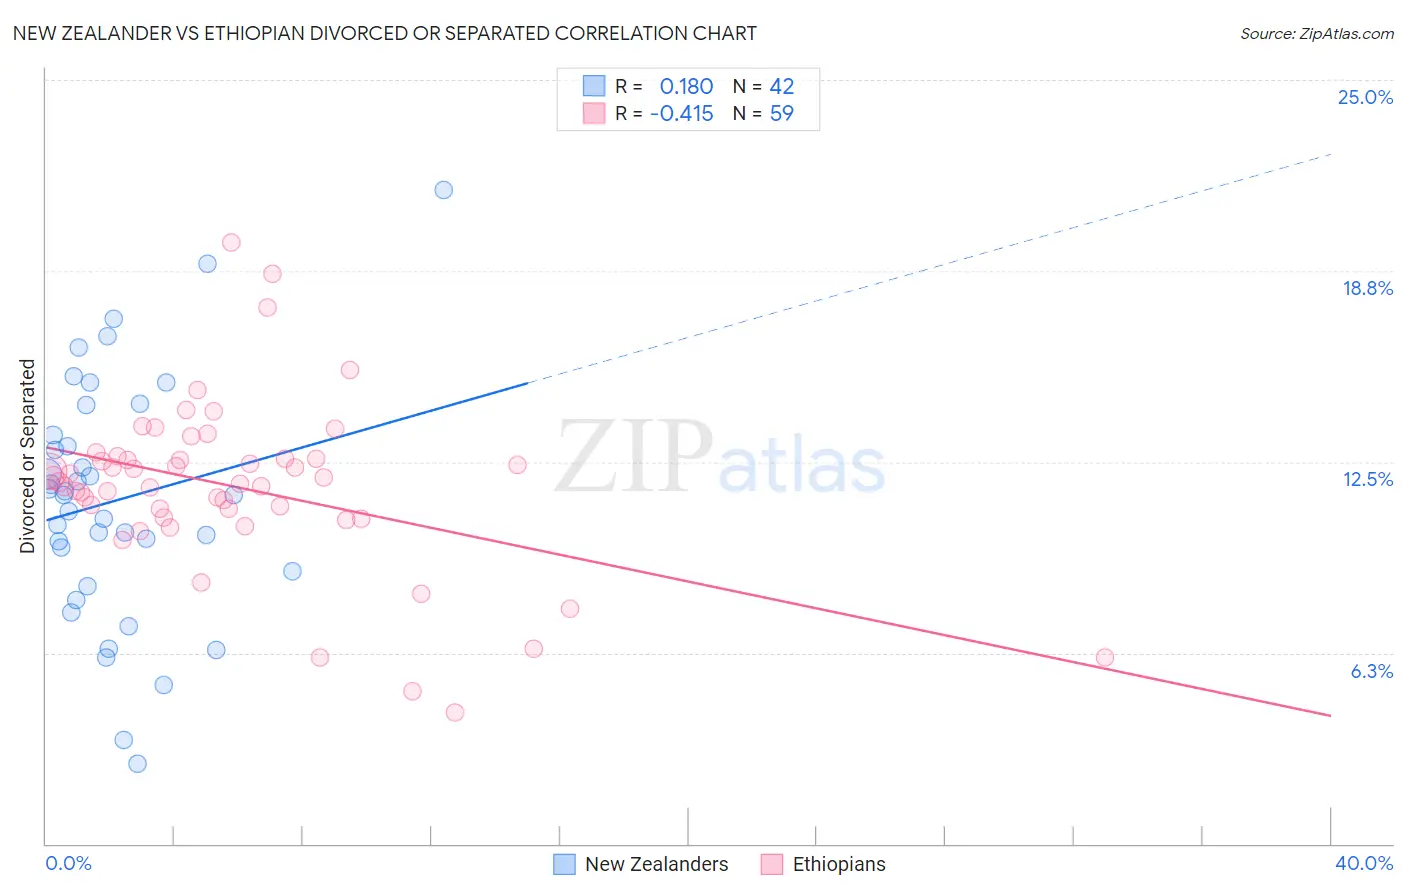
New Zealander vs Ethiopian Divorced or Separated Correlation Chart
The statistical analysis conducted on geographies consisting of 106,899,589 people shows a poor positive correlation between the proportion of New Zealanders and percentage of population currently divorced or separated in the United States with a correlation coefficient (R) of 0.180 and weighted average of 11.9%. Similarly, the statistical analysis conducted on geographies consisting of 223,166,328 people shows a moderate negative correlation between the proportion of Ethiopians and percentage of population currently divorced or separated in the United States with a correlation coefficient (R) of -0.415 and weighted average of 12.0%, a difference of 1.4%.
Divorced or Separated Correlation Summary
| Measurement | New Zealander | Ethiopian |
| Minimum | 2.6% | 4.3% |
| Maximum | 21.4% | 19.7% |
| Range | 18.8% | 15.4% |
| Mean | 11.2% | 11.7% |
| Median | 11.4% | 11.8% |
| Interquartile 25% (IQ1) | 8.9% | 10.7% |
| Interquartile 75% (IQ3) | 13.4% | 12.6% |
| Interquartile Range (IQR) | 4.5% | 1.9% |
| Standard Deviation (Sample) | 4.0% | 2.8% |
| Standard Deviation (Population) | 3.9% | 2.8% |
Similar Demographics by Divorced or Separated
Demographics Similar to New Zealanders by Divorced or Separated
In terms of divorced or separated, the demographic groups most similar to New Zealanders are Immigrants from Afghanistan (11.8%, a difference of 0.030%), Immigrants from Austria (11.8%, a difference of 0.060%), Immigrants from Cambodia (11.8%, a difference of 0.060%), Immigrants from St. Vincent and the Grenadines (11.8%, a difference of 0.070%), and Immigrants from Ecuador (11.8%, a difference of 0.11%).
| Demographics | Rating | Rank | Divorced or Separated |
| South American Indians | 92.1 /100 | #126 | Exceptional 11.8% |
| South Africans | 88.9 /100 | #127 | Excellent 11.8% |
| Immigrants | Ecuador | 88.9 /100 | #128 | Excellent 11.8% |
| Immigrants | St. Vincent and the Grenadines | 88.4 /100 | #129 | Excellent 11.8% |
| Immigrants | Austria | 88.2 /100 | #130 | Excellent 11.8% |
| Immigrants | Cambodia | 88.2 /100 | #131 | Excellent 11.8% |
| Immigrants | Afghanistan | 87.9 /100 | #132 | Excellent 11.8% |
| New Zealanders | 87.5 /100 | #133 | Excellent 11.9% |
| Argentineans | 85.1 /100 | #134 | Excellent 11.9% |
| Danes | 84.8 /100 | #135 | Excellent 11.9% |
| Carpatho Rusyns | 84.8 /100 | #136 | Excellent 11.9% |
| Alsatians | 84.0 /100 | #137 | Excellent 11.9% |
| Immigrants | Netherlands | 83.9 /100 | #138 | Excellent 11.9% |
| Australians | 83.6 /100 | #139 | Excellent 11.9% |
| Lebanese | 83.4 /100 | #140 | Excellent 11.9% |
Demographics Similar to Ethiopians by Divorced or Separated
In terms of divorced or separated, the demographic groups most similar to Ethiopians are Serbian (12.0%, a difference of 0.050%), Immigrants from Peru (12.0%, a difference of 0.050%), Tohono O'odham (12.0%, a difference of 0.070%), Mexican American Indian (12.0%, a difference of 0.10%), and German Russian (12.0%, a difference of 0.12%).
| Demographics | Rating | Rank | Divorced or Separated |
| Immigrants | Scotland | 65.8 /100 | #160 | Good 12.0% |
| Marshallese | 64.6 /100 | #161 | Good 12.0% |
| Samoans | 64.3 /100 | #162 | Good 12.0% |
| Navajo | 63.9 /100 | #163 | Good 12.0% |
| Swiss | 63.6 /100 | #164 | Good 12.0% |
| German Russians | 61.8 /100 | #165 | Good 12.0% |
| Tohono O'odham | 60.4 /100 | #166 | Good 12.0% |
| Ethiopians | 58.5 /100 | #167 | Average 12.0% |
| Serbians | 57.1 /100 | #168 | Average 12.0% |
| Immigrants | Peru | 57.0 /100 | #169 | Average 12.0% |
| Mexican American Indians | 55.8 /100 | #170 | Average 12.0% |
| Costa Ricans | 53.3 /100 | #171 | Average 12.0% |
| Immigrants | Mexico | 53.2 /100 | #172 | Average 12.0% |
| Immigrants | Moldova | 50.4 /100 | #173 | Average 12.1% |
| Hawaiians | 50.0 /100 | #174 | Average 12.1% |