Immigrants from Mexico vs Ethiopian Divorced or Separated
COMPARE
Immigrants from Mexico
Ethiopian
Divorced or Separated
Divorced or Separated Comparison
Immigrants from Mexico
Ethiopians
12.0%
DIVORCED OR SEPARATED
53.2/ 100
METRIC RATING
172nd/ 347
METRIC RANK
12.0%
DIVORCED OR SEPARATED
58.5/ 100
METRIC RATING
167th/ 347
METRIC RANK
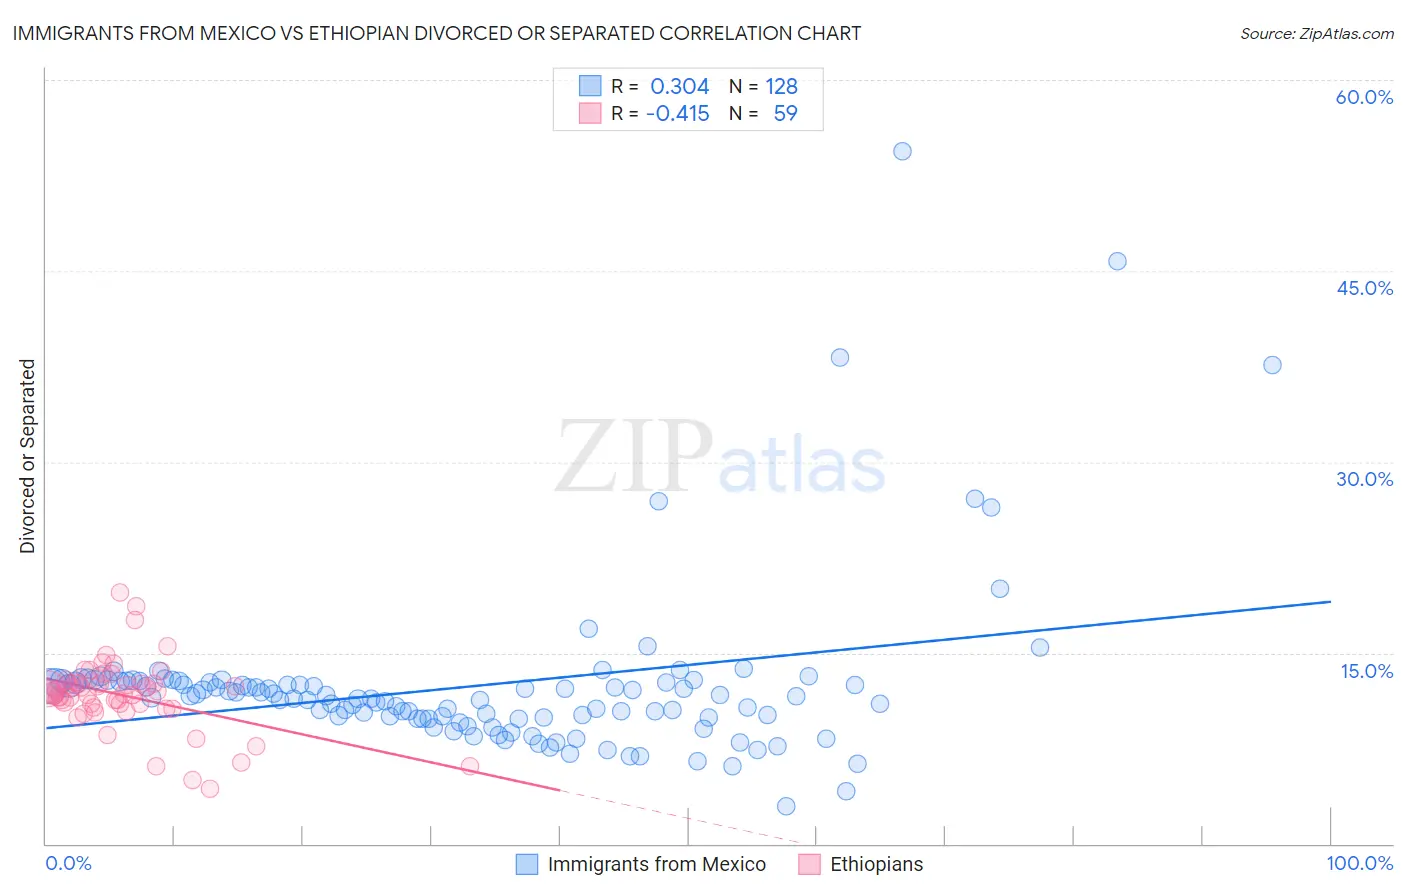
Immigrants from Mexico vs Ethiopian Divorced or Separated Correlation Chart
The statistical analysis conducted on geographies consisting of 513,547,698 people shows a mild positive correlation between the proportion of Immigrants from Mexico and percentage of population currently divorced or separated in the United States with a correlation coefficient (R) of 0.304 and weighted average of 12.0%. Similarly, the statistical analysis conducted on geographies consisting of 223,166,328 people shows a moderate negative correlation between the proportion of Ethiopians and percentage of population currently divorced or separated in the United States with a correlation coefficient (R) of -0.415 and weighted average of 12.0%, a difference of 0.19%.
Divorced or Separated Correlation Summary
| Measurement | Immigrants from Mexico | Ethiopian |
| Minimum | 3.0% | 4.3% |
| Maximum | 54.4% | 19.7% |
| Range | 51.4% | 15.4% |
| Mean | 12.4% | 11.7% |
| Median | 11.5% | 11.8% |
| Interquartile 25% (IQ1) | 9.9% | 10.7% |
| Interquartile 75% (IQ3) | 12.7% | 12.6% |
| Interquartile Range (IQR) | 2.8% | 1.9% |
| Standard Deviation (Sample) | 6.7% | 2.8% |
| Standard Deviation (Population) | 6.7% | 2.8% |
Demographics Similar to Immigrants from Mexico and Ethiopians by Divorced or Separated
In terms of divorced or separated, the demographic groups most similar to Immigrants from Mexico are Costa Rican (12.0%, a difference of 0.010%), Mexican American Indian (12.0%, a difference of 0.090%), Immigrants from Moldova (12.1%, a difference of 0.090%), Hawaiian (12.1%, a difference of 0.11%), and Immigrants from Sierra Leone (12.1%, a difference of 0.11%). Similarly, the demographic groups most similar to Ethiopians are Serbian (12.0%, a difference of 0.050%), Immigrants from Peru (12.0%, a difference of 0.050%), Tohono O'odham (12.0%, a difference of 0.070%), Mexican American Indian (12.0%, a difference of 0.10%), and German Russian (12.0%, a difference of 0.12%).
| Demographics | Rating | Rank | Divorced or Separated |
| Immigrants | Barbados | 66.0 /100 | #159 | Good 12.0% |
| Immigrants | Scotland | 65.8 /100 | #160 | Good 12.0% |
| Marshallese | 64.6 /100 | #161 | Good 12.0% |
| Samoans | 64.3 /100 | #162 | Good 12.0% |
| Navajo | 63.9 /100 | #163 | Good 12.0% |
| Swiss | 63.6 /100 | #164 | Good 12.0% |
| German Russians | 61.8 /100 | #165 | Good 12.0% |
| Tohono O'odham | 60.4 /100 | #166 | Good 12.0% |
| Ethiopians | 58.5 /100 | #167 | Average 12.0% |
| Serbians | 57.1 /100 | #168 | Average 12.0% |
| Immigrants | Peru | 57.0 /100 | #169 | Average 12.0% |
| Mexican American Indians | 55.8 /100 | #170 | Average 12.0% |
| Costa Ricans | 53.3 /100 | #171 | Average 12.0% |
| Immigrants | Mexico | 53.2 /100 | #172 | Average 12.0% |
| Immigrants | Moldova | 50.4 /100 | #173 | Average 12.1% |
| Hawaiians | 50.0 /100 | #174 | Average 12.1% |
| Immigrants | Sierra Leone | 50.0 /100 | #175 | Average 12.1% |
| Pennsylvania Germans | 48.9 /100 | #176 | Average 12.1% |
| Brazilians | 47.7 /100 | #177 | Average 12.1% |
| Ghanaians | 45.9 /100 | #178 | Average 12.1% |
| Immigrants | Western Europe | 45.6 /100 | #179 | Average 12.1% |