Immigrants from Romania vs Cape Verdean Divorced or Separated
COMPARE
Immigrants from Romania
Cape Verdean
Divorced or Separated
Divorced or Separated Comparison
Immigrants from Romania
Cape Verdeans
11.5%
DIVORCED OR SEPARATED
99.3/ 100
METRIC RATING
82nd/ 347
METRIC RANK
13.1%
DIVORCED OR SEPARATED
0.0/ 100
METRIC RATING
303rd/ 347
METRIC RANK
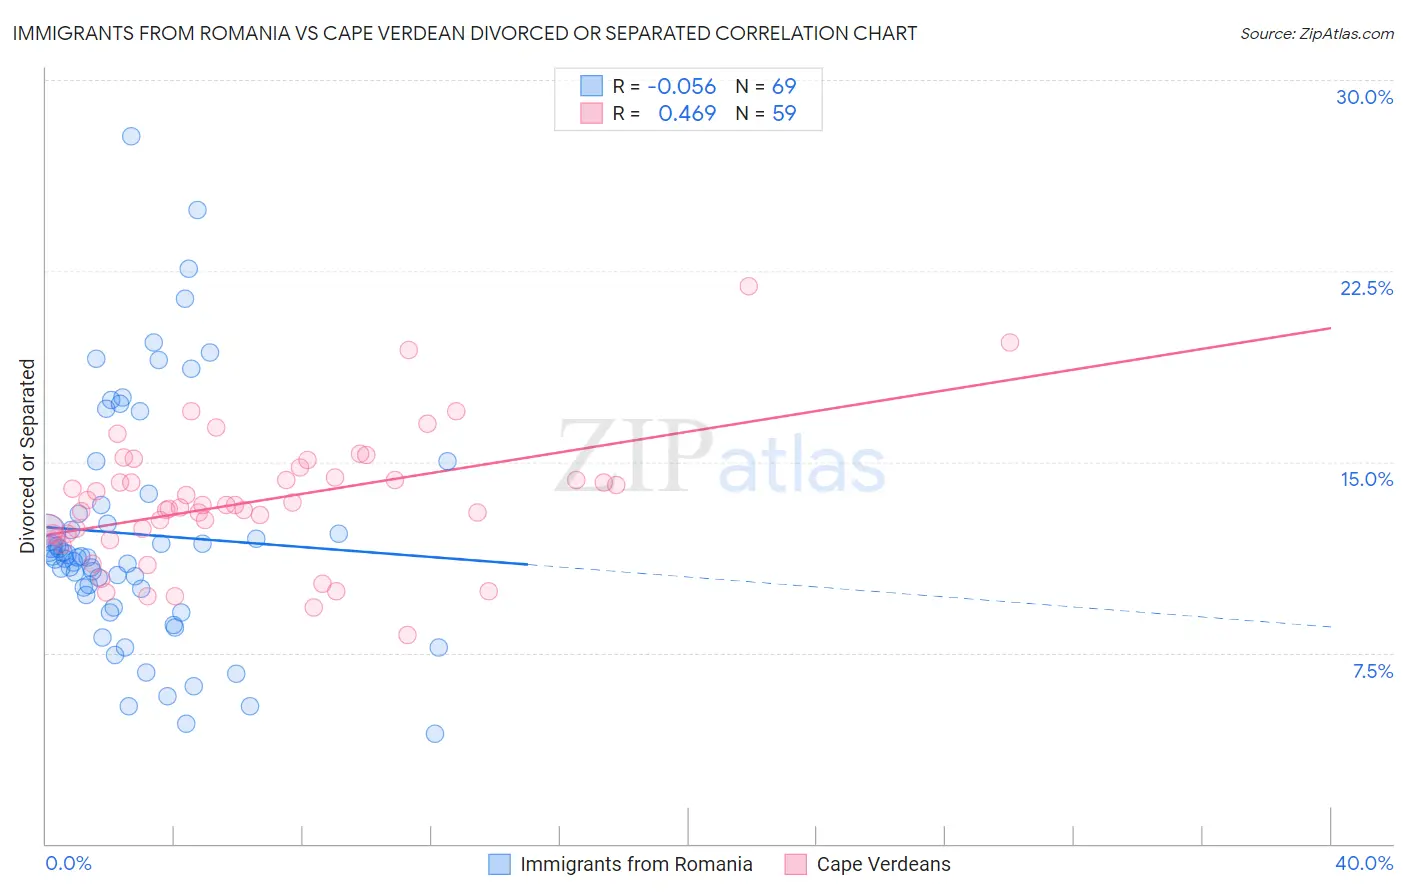
Immigrants from Romania vs Cape Verdean Divorced or Separated Correlation Chart
The statistical analysis conducted on geographies consisting of 256,993,939 people shows a slight negative correlation between the proportion of Immigrants from Romania and percentage of population currently divorced or separated in the United States with a correlation coefficient (R) of -0.056 and weighted average of 11.5%. Similarly, the statistical analysis conducted on geographies consisting of 107,557,736 people shows a moderate positive correlation between the proportion of Cape Verdeans and percentage of population currently divorced or separated in the United States with a correlation coefficient (R) of 0.469 and weighted average of 13.1%, a difference of 14.0%.
Divorced or Separated Correlation Summary
| Measurement | Immigrants from Romania | Cape Verdean |
| Minimum | 4.3% | 8.2% |
| Maximum | 27.8% | 21.9% |
| Range | 23.5% | 13.7% |
| Mean | 12.2% | 13.4% |
| Median | 11.3% | 13.3% |
| Interquartile 25% (IQ1) | 9.5% | 12.2% |
| Interquartile 75% (IQ3) | 13.5% | 14.4% |
| Interquartile Range (IQR) | 4.0% | 2.2% |
| Standard Deviation (Sample) | 4.7% | 2.6% |
| Standard Deviation (Population) | 4.7% | 2.5% |
Similar Demographics by Divorced or Separated
Demographics Similar to Immigrants from Romania by Divorced or Separated
In terms of divorced or separated, the demographic groups most similar to Immigrants from Romania are Immigrants from Bulgaria (11.5%, a difference of 0.030%), Bulgarian (11.5%, a difference of 0.050%), Russian (11.5%, a difference of 0.080%), Immigrants from Switzerland (11.5%, a difference of 0.090%), and Guyanese (11.5%, a difference of 0.11%).
| Demographics | Rating | Rank | Divorced or Separated |
| Immigrants | Northern Africa | 99.6 /100 | #75 | Exceptional 11.5% |
| Albanians | 99.6 /100 | #76 | Exceptional 11.5% |
| Immigrants | Italy | 99.5 /100 | #77 | Exceptional 11.5% |
| Afghans | 99.4 /100 | #78 | Exceptional 11.5% |
| Guyanese | 99.4 /100 | #79 | Exceptional 11.5% |
| Immigrants | Switzerland | 99.4 /100 | #80 | Exceptional 11.5% |
| Russians | 99.4 /100 | #81 | Exceptional 11.5% |
| Immigrants | Romania | 99.3 /100 | #82 | Exceptional 11.5% |
| Immigrants | Bulgaria | 99.3 /100 | #83 | Exceptional 11.5% |
| Bulgarians | 99.3 /100 | #84 | Exceptional 11.5% |
| Immigrants | Albania | 99.3 /100 | #85 | Exceptional 11.5% |
| Immigrants | Latvia | 99.2 /100 | #86 | Exceptional 11.6% |
| Immigrants | Nepal | 99.2 /100 | #87 | Exceptional 11.6% |
| Immigrants | Europe | 99.2 /100 | #88 | Exceptional 11.6% |
| Immigrants | Southern Europe | 99.1 /100 | #89 | Exceptional 11.6% |
Demographics Similar to Cape Verdeans by Divorced or Separated
In terms of divorced or separated, the demographic groups most similar to Cape Verdeans are Immigrants from Venezuela (13.1%, a difference of 0.020%), Alaskan Athabascan (13.1%, a difference of 0.12%), Hopi (13.2%, a difference of 0.13%), Chippewa (13.2%, a difference of 0.18%), and Immigrants from Cabo Verde (13.1%, a difference of 0.33%).
| Demographics | Rating | Rank | Divorced or Separated |
| Nicaraguans | 0.0 /100 | #296 | Tragic 13.0% |
| Natives/Alaskans | 0.0 /100 | #297 | Tragic 13.0% |
| Venezuelans | 0.0 /100 | #298 | Tragic 13.0% |
| Immigrants | Jamaica | 0.0 /100 | #299 | Tragic 13.0% |
| Immigrants | Cabo Verde | 0.0 /100 | #300 | Tragic 13.1% |
| Alaskan Athabascans | 0.0 /100 | #301 | Tragic 13.1% |
| Immigrants | Venezuela | 0.0 /100 | #302 | Tragic 13.1% |
| Cape Verdeans | 0.0 /100 | #303 | Tragic 13.1% |
| Hopi | 0.0 /100 | #304 | Tragic 13.2% |
| Chippewa | 0.0 /100 | #305 | Tragic 13.2% |
| Tlingit-Haida | 0.0 /100 | #306 | Tragic 13.2% |
| French American Indians | 0.0 /100 | #307 | Tragic 13.2% |
| Ottawa | 0.0 /100 | #308 | Tragic 13.2% |
| Americans | 0.0 /100 | #309 | Tragic 13.2% |
| Africans | 0.0 /100 | #310 | Tragic 13.2% |