Nigerian vs Tsimshian Births to Unmarried Women
COMPARE
Nigerian
Tsimshian
Births to Unmarried Women
Births to Unmarried Women Comparison
Nigerians
Tsimshian
35.3%
BIRTHS TO UNMARRIED WOMEN
0.7/ 100
METRIC RATING
246th/ 347
METRIC RANK
42.2%
BIRTHS TO UNMARRIED WOMEN
0.0/ 100
METRIC RATING
327th/ 347
METRIC RANK
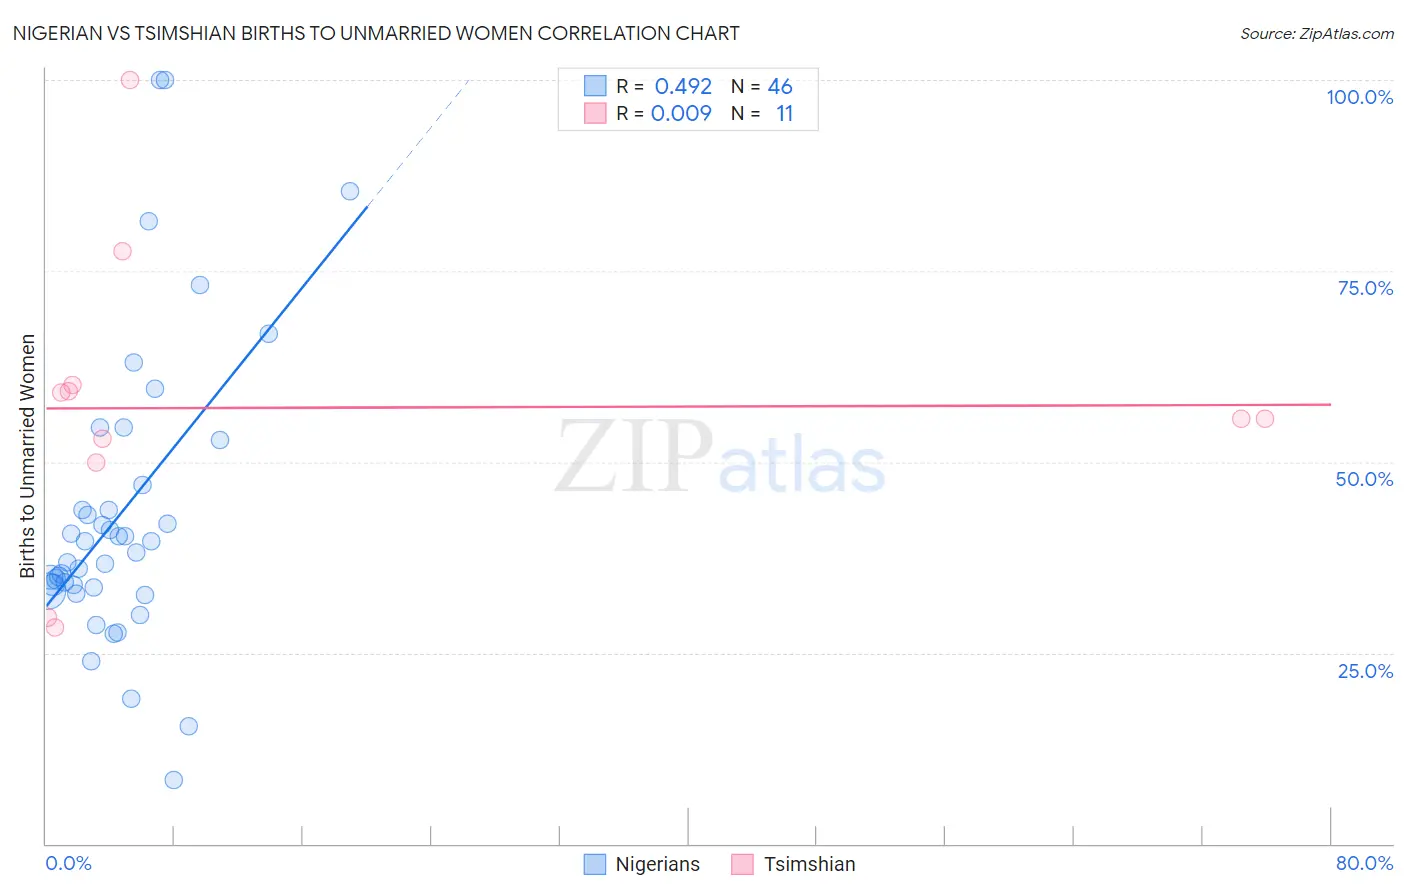
Nigerian vs Tsimshian Births to Unmarried Women Correlation Chart
The statistical analysis conducted on geographies consisting of 318,352,588 people shows a moderate positive correlation between the proportion of Nigerians and percentage of births to unmarried women in the United States with a correlation coefficient (R) of 0.492 and weighted average of 35.3%. Similarly, the statistical analysis conducted on geographies consisting of 15,351,381 people shows no correlation between the proportion of Tsimshian and percentage of births to unmarried women in the United States with a correlation coefficient (R) of 0.009 and weighted average of 42.2%, a difference of 19.3%.
Births to Unmarried Women Correlation Summary
| Measurement | Nigerian | Tsimshian |
| Minimum | 8.3% | 28.3% |
| Maximum | 100.0% | 100.0% |
| Range | 91.7% | 71.7% |
| Mean | 43.4% | 57.1% |
| Median | 38.8% | 55.6% |
| Interquartile 25% (IQ1) | 33.6% | 50.0% |
| Interquartile 75% (IQ3) | 46.9% | 60.0% |
| Interquartile Range (IQR) | 13.3% | 10.0% |
| Standard Deviation (Sample) | 19.5% | 19.8% |
| Standard Deviation (Population) | 19.3% | 18.9% |
Similar Demographics by Births to Unmarried Women
Demographics Similar to Nigerians by Births to Unmarried Women
In terms of births to unmarried women, the demographic groups most similar to Nigerians are Shoshone (35.3%, a difference of 0.11%), Immigrants from Nigeria (35.4%, a difference of 0.21%), Guyanese (35.2%, a difference of 0.45%), Japanese (35.2%, a difference of 0.51%), and Nonimmigrants (35.5%, a difference of 0.54%).
| Demographics | Rating | Rank | Births to Unmarried Women |
| Sierra Leoneans | 1.4 /100 | #239 | Tragic 34.9% |
| Immigrants | Middle Africa | 1.2 /100 | #240 | Tragic 34.9% |
| Immigrants | Guyana | 1.2 /100 | #241 | Tragic 35.0% |
| Indonesians | 1.2 /100 | #242 | Tragic 35.0% |
| Japanese | 0.9 /100 | #243 | Tragic 35.2% |
| Guyanese | 0.9 /100 | #244 | Tragic 35.2% |
| Shoshone | 0.8 /100 | #245 | Tragic 35.3% |
| Nigerians | 0.7 /100 | #246 | Tragic 35.3% |
| Immigrants | Nigeria | 0.7 /100 | #247 | Tragic 35.4% |
| Immigrants | Nonimmigrants | 0.6 /100 | #248 | Tragic 35.5% |
| Bermudans | 0.6 /100 | #249 | Tragic 35.5% |
| Mexican American Indians | 0.4 /100 | #250 | Tragic 35.7% |
| Immigrants | Western Africa | 0.3 /100 | #251 | Tragic 36.0% |
| Salvadorans | 0.3 /100 | #252 | Tragic 36.0% |
| Immigrants | Portugal | 0.2 /100 | #253 | Tragic 36.2% |
Demographics Similar to Tsimshian by Births to Unmarried Women
In terms of births to unmarried women, the demographic groups most similar to Tsimshian are Immigrants from Cabo Verde (42.2%, a difference of 0.13%), Paiute (42.5%, a difference of 0.74%), Chippewa (42.6%, a difference of 1.1%), Immigrants from Cuba (41.5%, a difference of 1.7%), and Cheyenne (41.3%, a difference of 1.9%).
| Demographics | Rating | Rank | Births to Unmarried Women |
| Crow | 0.0 /100 | #320 | Tragic 40.4% |
| Bahamians | 0.0 /100 | #321 | Tragic 40.8% |
| Cajuns | 0.0 /100 | #322 | Tragic 41.0% |
| Sioux | 0.0 /100 | #323 | Tragic 41.0% |
| Cape Verdeans | 0.0 /100 | #324 | Tragic 41.3% |
| Cheyenne | 0.0 /100 | #325 | Tragic 41.3% |
| Immigrants | Cuba | 0.0 /100 | #326 | Tragic 41.5% |
| Tsimshian | 0.0 /100 | #327 | Tragic 42.2% |
| Immigrants | Cabo Verde | 0.0 /100 | #328 | Tragic 42.2% |
| Paiute | 0.0 /100 | #329 | Tragic 42.5% |
| Chippewa | 0.0 /100 | #330 | Tragic 42.6% |
| Natives/Alaskans | 0.0 /100 | #331 | Tragic 43.0% |
| Kiowa | 0.0 /100 | #332 | Tragic 43.1% |
| Blacks/African Americans | 0.0 /100 | #333 | Tragic 44.3% |
| Yuman | 0.0 /100 | #334 | Tragic 44.4% |