Nicaraguan vs Burmese Family Households
COMPARE
Nicaraguan
Burmese
Family Households
Family Households Comparison
Nicaraguans
Burmese
67.4%
FAMILY HOUSEHOLDS
100.0/ 100
METRIC RATING
29th/ 347
METRIC RANK
65.7%
FAMILY HOUSEHOLDS
99.9/ 100
METRIC RATING
74th/ 347
METRIC RANK
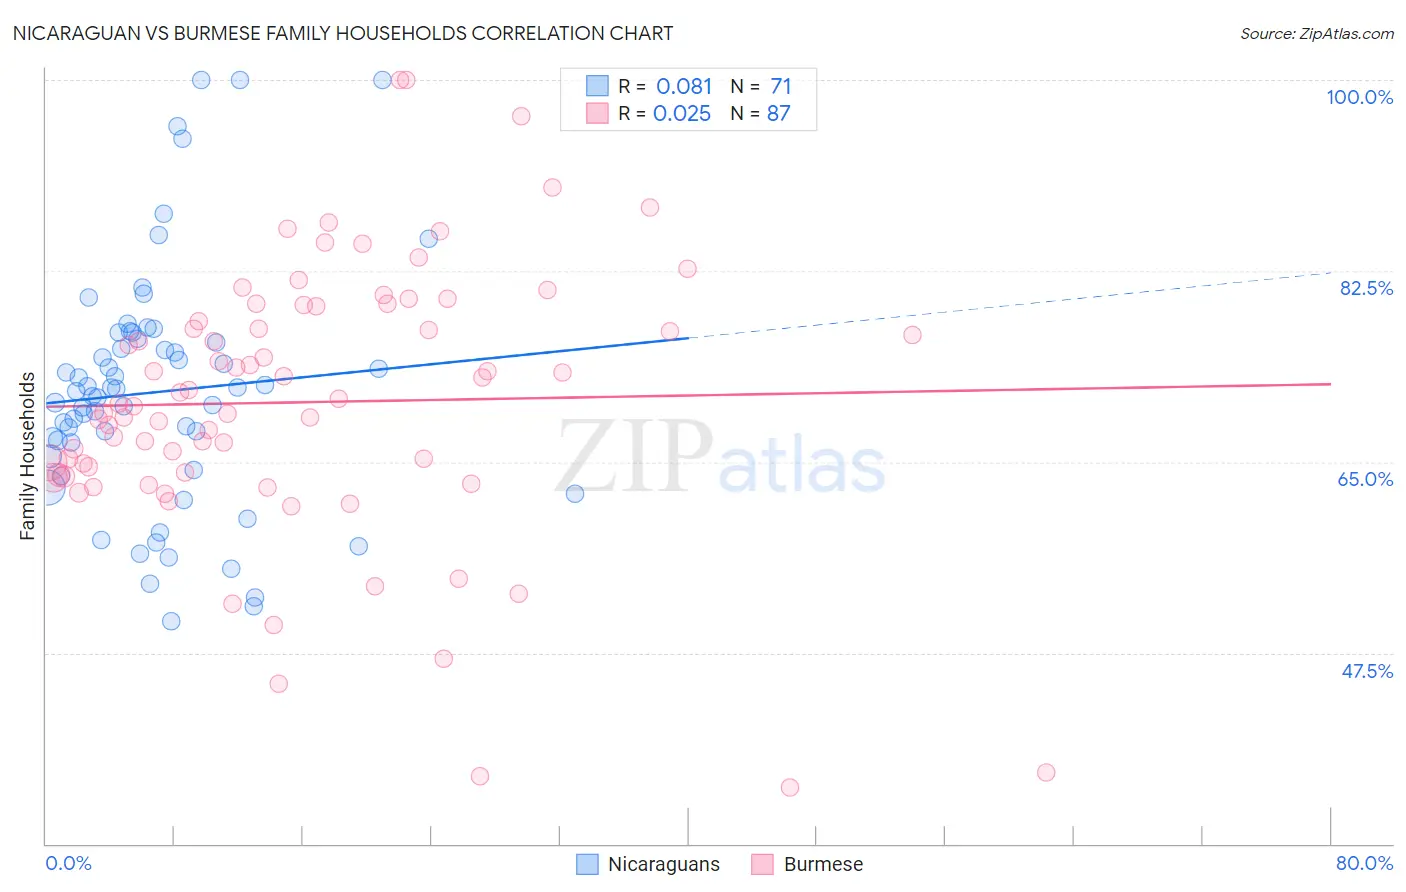
Nicaraguan vs Burmese Family Households Correlation Chart
The statistical analysis conducted on geographies consisting of 285,625,723 people shows a slight positive correlation between the proportion of Nicaraguans and percentage of family households in the United States with a correlation coefficient (R) of 0.081 and weighted average of 67.4%. Similarly, the statistical analysis conducted on geographies consisting of 464,897,249 people shows no correlation between the proportion of Burmese and percentage of family households in the United States with a correlation coefficient (R) of 0.025 and weighted average of 65.7%, a difference of 2.5%.
Family Households Correlation Summary
| Measurement | Nicaraguan | Burmese |
| Minimum | 50.4% | 35.2% |
| Maximum | 100.0% | 100.0% |
| Range | 49.6% | 64.8% |
| Mean | 71.4% | 70.5% |
| Median | 71.5% | 70.3% |
| Interquartile 25% (IQ1) | 65.5% | 63.8% |
| Interquartile 75% (IQ3) | 76.3% | 79.2% |
| Interquartile Range (IQR) | 10.8% | 15.4% |
| Standard Deviation (Sample) | 11.0% | 12.5% |
| Standard Deviation (Population) | 10.9% | 12.5% |
Similar Demographics by Family Households
Demographics Similar to Nicaraguans by Family Households
In terms of family households, the demographic groups most similar to Nicaraguans are Hawaiian (67.4%, a difference of 0.070%), Hispanic or Latino (67.4%, a difference of 0.080%), Immigrants from India (67.4%, a difference of 0.13%), Immigrants from Nicaragua (67.5%, a difference of 0.14%), and Immigrants from South Eastern Asia (67.5%, a difference of 0.16%).
| Demographics | Rating | Rank | Family Households |
| Sri Lankans | 100.0 /100 | #22 | Exceptional 67.7% |
| Immigrants | Pakistan | 100.0 /100 | #23 | Exceptional 67.7% |
| Immigrants | South Eastern Asia | 100.0 /100 | #24 | Exceptional 67.5% |
| Immigrants | Nicaragua | 100.0 /100 | #25 | Exceptional 67.5% |
| Immigrants | India | 100.0 /100 | #26 | Exceptional 67.4% |
| Hispanics or Latinos | 100.0 /100 | #27 | Exceptional 67.4% |
| Hawaiians | 100.0 /100 | #28 | Exceptional 67.4% |
| Nicaraguans | 100.0 /100 | #29 | Exceptional 67.4% |
| Immigrants | Peru | 100.0 /100 | #30 | Exceptional 67.2% |
| Immigrants | Latin America | 100.0 /100 | #31 | Exceptional 67.2% |
| Nepalese | 100.0 /100 | #32 | Exceptional 67.2% |
| Salvadorans | 100.0 /100 | #33 | Exceptional 67.2% |
| Thais | 100.0 /100 | #34 | Exceptional 67.2% |
| Tohono O'odham | 100.0 /100 | #35 | Exceptional 67.1% |
| Peruvians | 100.0 /100 | #36 | Exceptional 67.1% |
Demographics Similar to Burmese by Family Households
In terms of family households, the demographic groups most similar to Burmese are Laotian (65.8%, a difference of 0.040%), Houma (65.7%, a difference of 0.050%), Portuguese (65.8%, a difference of 0.11%), Bhutanese (65.9%, a difference of 0.16%), and Immigrants from the Azores (65.6%, a difference of 0.17%).
| Demographics | Rating | Rank | Family Households |
| Filipinos | 99.9 /100 | #67 | Exceptional 65.9% |
| Japanese | 99.9 /100 | #68 | Exceptional 65.9% |
| Malaysians | 99.9 /100 | #69 | Exceptional 65.9% |
| Immigrants | Afghanistan | 99.9 /100 | #70 | Exceptional 65.9% |
| Bhutanese | 99.9 /100 | #71 | Exceptional 65.9% |
| Portuguese | 99.9 /100 | #72 | Exceptional 65.8% |
| Laotians | 99.9 /100 | #73 | Exceptional 65.8% |
| Burmese | 99.9 /100 | #74 | Exceptional 65.7% |
| Houma | 99.9 /100 | #75 | Exceptional 65.7% |
| Immigrants | Azores | 99.8 /100 | #76 | Exceptional 65.6% |
| Immigrants | South America | 99.8 /100 | #77 | Exceptional 65.6% |
| Yaqui | 99.8 /100 | #78 | Exceptional 65.6% |
| Immigrants | Costa Rica | 99.8 /100 | #79 | Exceptional 65.6% |
| Puget Sound Salish | 99.8 /100 | #80 | Exceptional 65.6% |
| Jordanians | 99.7 /100 | #81 | Exceptional 65.5% |