Nicaraguan vs Seminole Married-couple Households
COMPARE
Nicaraguan
Seminole
Married-couple Households
Married-couple Households Comparison
Nicaraguans
Seminole
45.2%
MARRIED-COUPLE HOUSEHOLDS
5.3/ 100
METRIC RATING
219th/ 347
METRIC RANK
44.0%
MARRIED-COUPLE HOUSEHOLDS
0.4/ 100
METRIC RATING
252nd/ 347
METRIC RANK
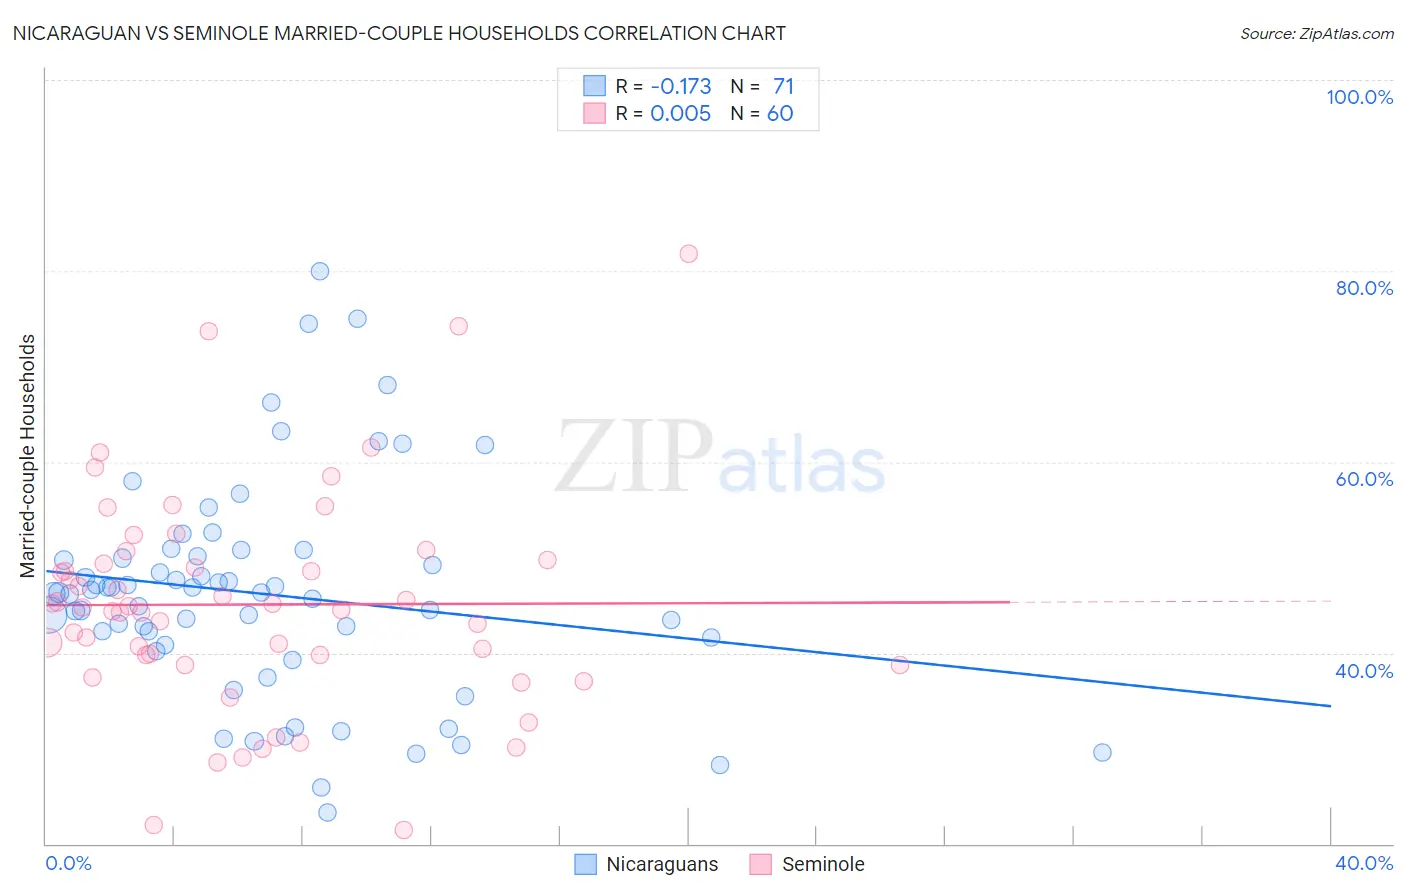
Nicaraguan vs Seminole Married-couple Households Correlation Chart
The statistical analysis conducted on geographies consisting of 285,610,844 people shows a poor negative correlation between the proportion of Nicaraguans and percentage of married-couple family households in the United States with a correlation coefficient (R) of -0.173 and weighted average of 45.2%. Similarly, the statistical analysis conducted on geographies consisting of 118,298,576 people shows no correlation between the proportion of Seminole and percentage of married-couple family households in the United States with a correlation coefficient (R) of 0.005 and weighted average of 44.0%, a difference of 2.7%.
Married-couple Households Correlation Summary
| Measurement | Nicaraguan | Seminole |
| Minimum | 23.2% | 21.4% |
| Maximum | 80.0% | 81.8% |
| Range | 56.8% | 60.4% |
| Mean | 46.2% | 45.1% |
| Median | 46.3% | 44.6% |
| Interquartile 25% (IQ1) | 40.8% | 39.2% |
| Interquartile 75% (IQ3) | 50.2% | 49.6% |
| Interquartile Range (IQR) | 9.4% | 10.3% |
| Standard Deviation (Sample) | 11.4% | 11.4% |
| Standard Deviation (Population) | 11.3% | 11.3% |
Similar Demographics by Married-couple Households
Demographics Similar to Nicaraguans by Married-couple Households
In terms of married-couple households, the demographic groups most similar to Nicaraguans are Immigrants from the Azores (45.2%, a difference of 0.010%), Panamanian (45.2%, a difference of 0.030%), Immigrants from Thailand (45.2%, a difference of 0.030%), Immigrants from Portugal (45.2%, a difference of 0.050%), and Immigrants from Nepal (45.2%, a difference of 0.060%).
| Demographics | Rating | Rank | Married-couple Households |
| Creek | 6.4 /100 | #212 | Tragic 45.3% |
| Yakama | 5.8 /100 | #213 | Tragic 45.2% |
| Japanese | 5.7 /100 | #214 | Tragic 45.2% |
| Immigrants | Nepal | 5.6 /100 | #215 | Tragic 45.2% |
| Immigrants | Portugal | 5.6 /100 | #216 | Tragic 45.2% |
| Panamanians | 5.5 /100 | #217 | Tragic 45.2% |
| Immigrants | Azores | 5.3 /100 | #218 | Tragic 45.2% |
| Nicaraguans | 5.3 /100 | #219 | Tragic 45.2% |
| Immigrants | Thailand | 5.1 /100 | #220 | Tragic 45.2% |
| Tlingit-Haida | 4.9 /100 | #221 | Tragic 45.1% |
| Immigrants | Laos | 4.6 /100 | #222 | Tragic 45.1% |
| Immigrants | Cambodia | 2.7 /100 | #223 | Tragic 44.9% |
| Immigrants | Micronesia | 2.6 /100 | #224 | Tragic 44.9% |
| Dutch West Indians | 2.6 /100 | #225 | Tragic 44.9% |
| Alsatians | 2.3 /100 | #226 | Tragic 44.8% |
Demographics Similar to Seminole by Married-couple Households
In terms of married-couple households, the demographic groups most similar to Seminole are German Russian (44.0%, a difference of 0.070%), Central American (43.9%, a difference of 0.12%), French American Indian (44.1%, a difference of 0.15%), Immigrants from Kenya (44.1%, a difference of 0.16%), and Apache (43.9%, a difference of 0.17%).
| Demographics | Rating | Rank | Married-couple Households |
| Immigrants | El Salvador | 0.7 /100 | #245 | Tragic 44.3% |
| Immigrants | Cuba | 0.6 /100 | #246 | Tragic 44.2% |
| Immigrants | Morocco | 0.6 /100 | #247 | Tragic 44.2% |
| Yup'ik | 0.4 /100 | #248 | Tragic 44.1% |
| Immigrants | Kenya | 0.4 /100 | #249 | Tragic 44.1% |
| French American Indians | 0.4 /100 | #250 | Tragic 44.1% |
| German Russians | 0.4 /100 | #251 | Tragic 44.0% |
| Seminole | 0.4 /100 | #252 | Tragic 44.0% |
| Central Americans | 0.3 /100 | #253 | Tragic 43.9% |
| Apache | 0.3 /100 | #254 | Tragic 43.9% |
| Shoshone | 0.3 /100 | #255 | Tragic 43.9% |
| Ugandans | 0.3 /100 | #256 | Tragic 43.8% |
| Blackfeet | 0.2 /100 | #257 | Tragic 43.8% |
| Central American Indians | 0.2 /100 | #258 | Tragic 43.8% |
| Iroquois | 0.2 /100 | #259 | Tragic 43.7% |