Cajun vs Seminole Married-couple Households
COMPARE
Cajun
Seminole
Married-couple Households
Married-couple Households Comparison
Cajuns
Seminole
46.4%
MARRIED-COUPLE HOUSEHOLDS
45.2/ 100
METRIC RATING
176th/ 347
METRIC RANK
44.0%
MARRIED-COUPLE HOUSEHOLDS
0.4/ 100
METRIC RATING
252nd/ 347
METRIC RANK
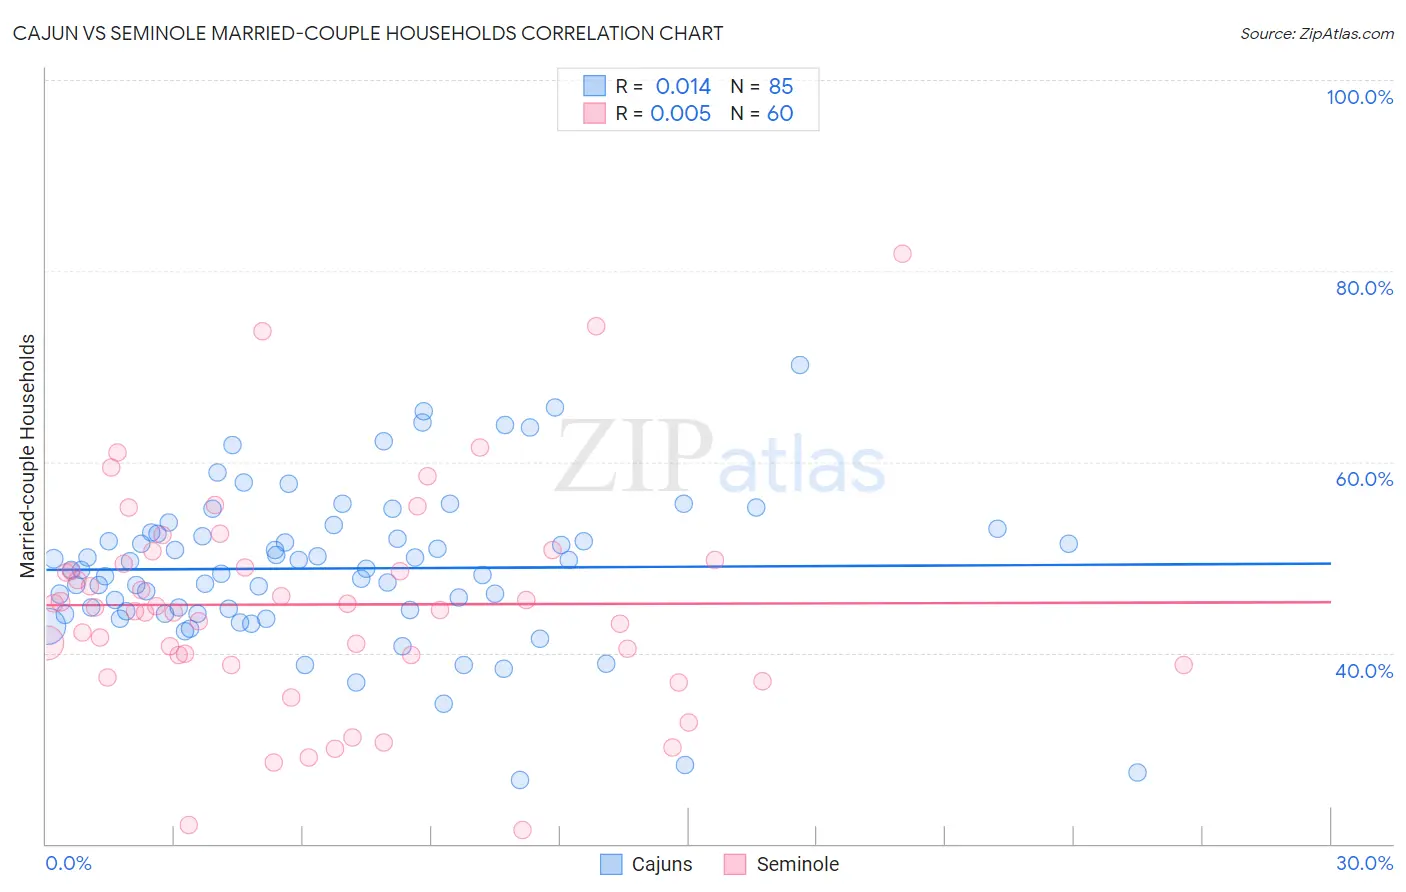
Cajun vs Seminole Married-couple Households Correlation Chart
The statistical analysis conducted on geographies consisting of 149,695,454 people shows no correlation between the proportion of Cajuns and percentage of married-couple family households in the United States with a correlation coefficient (R) of 0.014 and weighted average of 46.4%. Similarly, the statistical analysis conducted on geographies consisting of 118,298,576 people shows no correlation between the proportion of Seminole and percentage of married-couple family households in the United States with a correlation coefficient (R) of 0.005 and weighted average of 44.0%, a difference of 5.4%.
Married-couple Households Correlation Summary
| Measurement | Cajun | Seminole |
| Minimum | 26.7% | 21.4% |
| Maximum | 70.1% | 81.8% |
| Range | 43.5% | 60.4% |
| Mean | 48.8% | 45.1% |
| Median | 48.6% | 44.6% |
| Interquartile 25% (IQ1) | 44.2% | 39.2% |
| Interquartile 75% (IQ3) | 52.6% | 49.6% |
| Interquartile Range (IQR) | 8.4% | 10.3% |
| Standard Deviation (Sample) | 8.0% | 11.4% |
| Standard Deviation (Population) | 8.0% | 11.3% |
Similar Demographics by Married-couple Households
Demographics Similar to Cajuns by Married-couple Households
In terms of married-couple households, the demographic groups most similar to Cajuns are Immigrants from Colombia (46.4%, a difference of 0.030%), Immigrants (46.3%, a difference of 0.060%), Immigrants from Costa Rica (46.3%, a difference of 0.070%), Immigrants from Zimbabwe (46.3%, a difference of 0.090%), and Mongolian (46.3%, a difference of 0.12%).
| Demographics | Rating | Rank | Married-couple Households |
| Spanish American Indians | 59.4 /100 | #169 | Average 46.6% |
| South Americans | 58.0 /100 | #170 | Average 46.6% |
| Immigrants | Chile | 55.7 /100 | #171 | Average 46.5% |
| Immigrants | Australia | 54.6 /100 | #172 | Average 46.5% |
| Immigrants | Norway | 52.0 /100 | #173 | Average 46.5% |
| Immigrants | Mexico | 50.0 /100 | #174 | Average 46.4% |
| Immigrants | Colombia | 46.1 /100 | #175 | Average 46.4% |
| Cajuns | 45.2 /100 | #176 | Average 46.4% |
| Immigrants | Immigrants | 43.8 /100 | #177 | Average 46.3% |
| Immigrants | Costa Rica | 43.4 /100 | #178 | Average 46.3% |
| Immigrants | Zimbabwe | 43.0 /100 | #179 | Average 46.3% |
| Mongolians | 42.0 /100 | #180 | Average 46.3% |
| Malaysians | 41.8 /100 | #181 | Average 46.3% |
| Yugoslavians | 38.9 /100 | #182 | Fair 46.2% |
| Immigrants | Brazil | 38.3 /100 | #183 | Fair 46.2% |
Demographics Similar to Seminole by Married-couple Households
In terms of married-couple households, the demographic groups most similar to Seminole are German Russian (44.0%, a difference of 0.070%), Central American (43.9%, a difference of 0.12%), French American Indian (44.1%, a difference of 0.15%), Immigrants from Kenya (44.1%, a difference of 0.16%), and Apache (43.9%, a difference of 0.17%).
| Demographics | Rating | Rank | Married-couple Households |
| Immigrants | El Salvador | 0.7 /100 | #245 | Tragic 44.3% |
| Immigrants | Cuba | 0.6 /100 | #246 | Tragic 44.2% |
| Immigrants | Morocco | 0.6 /100 | #247 | Tragic 44.2% |
| Yup'ik | 0.4 /100 | #248 | Tragic 44.1% |
| Immigrants | Kenya | 0.4 /100 | #249 | Tragic 44.1% |
| French American Indians | 0.4 /100 | #250 | Tragic 44.1% |
| German Russians | 0.4 /100 | #251 | Tragic 44.0% |
| Seminole | 0.4 /100 | #252 | Tragic 44.0% |
| Central Americans | 0.3 /100 | #253 | Tragic 43.9% |
| Apache | 0.3 /100 | #254 | Tragic 43.9% |
| Shoshone | 0.3 /100 | #255 | Tragic 43.9% |
| Ugandans | 0.3 /100 | #256 | Tragic 43.8% |
| Blackfeet | 0.2 /100 | #257 | Tragic 43.8% |
| Central American Indians | 0.2 /100 | #258 | Tragic 43.8% |
| Iroquois | 0.2 /100 | #259 | Tragic 43.7% |