Nicaraguan vs Paraguayan Married-couple Households
COMPARE
Nicaraguan
Paraguayan
Married-couple Households
Married-couple Households Comparison
Nicaraguans
Paraguayans
45.2%
MARRIED-COUPLE HOUSEHOLDS
5.3/ 100
METRIC RATING
219th/ 347
METRIC RANK
47.0%
MARRIED-COUPLE HOUSEHOLDS
78.7/ 100
METRIC RATING
149th/ 347
METRIC RANK
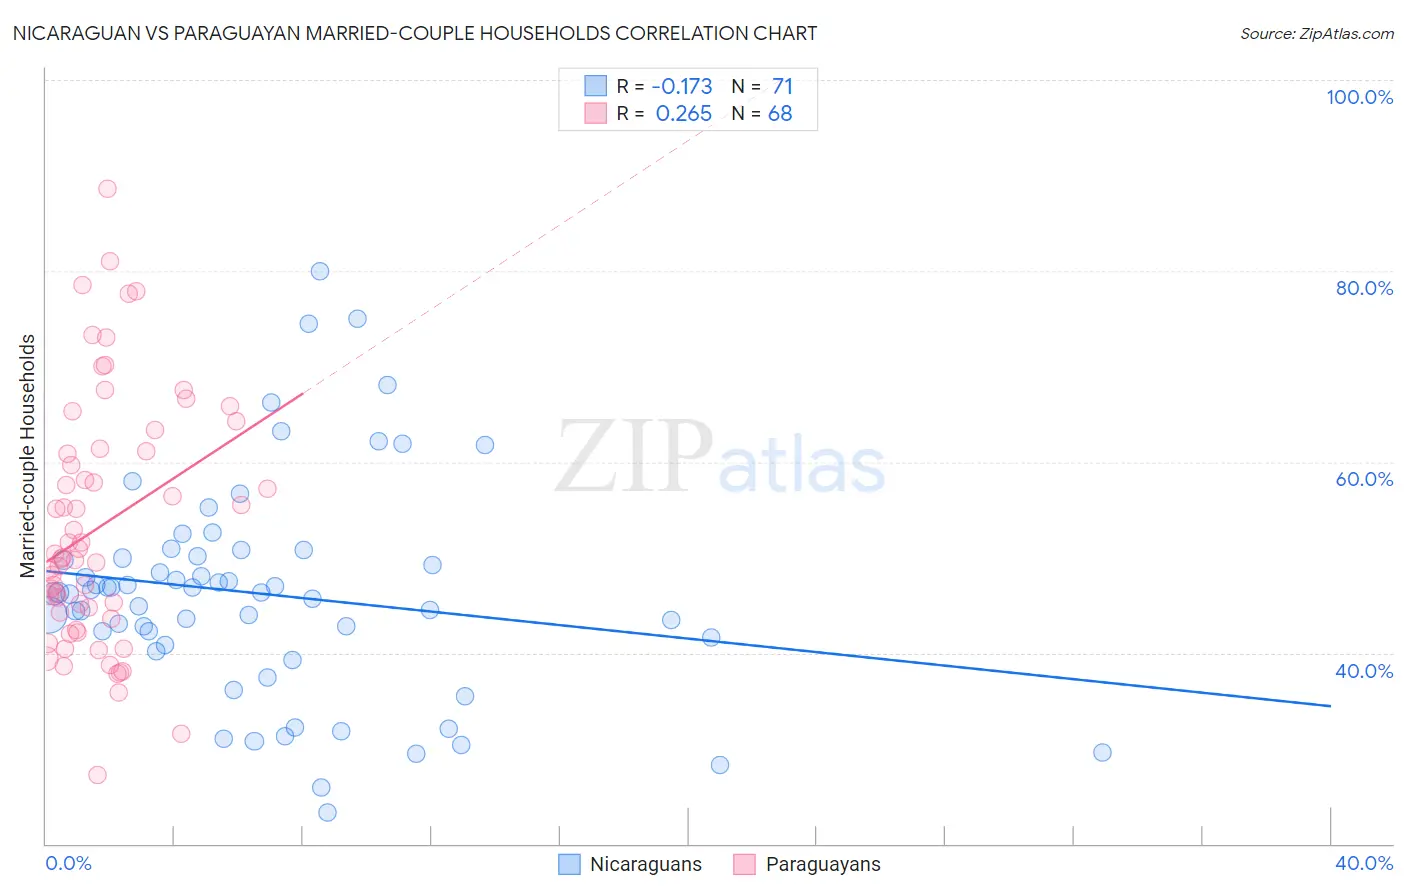
Nicaraguan vs Paraguayan Married-couple Households Correlation Chart
The statistical analysis conducted on geographies consisting of 285,610,844 people shows a poor negative correlation between the proportion of Nicaraguans and percentage of married-couple family households in the United States with a correlation coefficient (R) of -0.173 and weighted average of 45.2%. Similarly, the statistical analysis conducted on geographies consisting of 95,096,913 people shows a weak positive correlation between the proportion of Paraguayans and percentage of married-couple family households in the United States with a correlation coefficient (R) of 0.265 and weighted average of 47.0%, a difference of 4.1%.
Married-couple Households Correlation Summary
| Measurement | Nicaraguan | Paraguayan |
| Minimum | 23.2% | 27.2% |
| Maximum | 80.0% | 88.5% |
| Range | 56.8% | 61.4% |
| Mean | 46.2% | 53.2% |
| Median | 46.3% | 50.2% |
| Interquartile 25% (IQ1) | 40.8% | 43.9% |
| Interquartile 75% (IQ3) | 50.2% | 61.2% |
| Interquartile Range (IQR) | 9.4% | 17.3% |
| Standard Deviation (Sample) | 11.4% | 12.9% |
| Standard Deviation (Population) | 11.3% | 12.8% |
Similar Demographics by Married-couple Households
Demographics Similar to Nicaraguans by Married-couple Households
In terms of married-couple households, the demographic groups most similar to Nicaraguans are Immigrants from the Azores (45.2%, a difference of 0.010%), Panamanian (45.2%, a difference of 0.030%), Immigrants from Thailand (45.2%, a difference of 0.030%), Immigrants from Portugal (45.2%, a difference of 0.050%), and Immigrants from Nepal (45.2%, a difference of 0.060%).
| Demographics | Rating | Rank | Married-couple Households |
| Creek | 6.4 /100 | #212 | Tragic 45.3% |
| Yakama | 5.8 /100 | #213 | Tragic 45.2% |
| Japanese | 5.7 /100 | #214 | Tragic 45.2% |
| Immigrants | Nepal | 5.6 /100 | #215 | Tragic 45.2% |
| Immigrants | Portugal | 5.6 /100 | #216 | Tragic 45.2% |
| Panamanians | 5.5 /100 | #217 | Tragic 45.2% |
| Immigrants | Azores | 5.3 /100 | #218 | Tragic 45.2% |
| Nicaraguans | 5.3 /100 | #219 | Tragic 45.2% |
| Immigrants | Thailand | 5.1 /100 | #220 | Tragic 45.2% |
| Tlingit-Haida | 4.9 /100 | #221 | Tragic 45.1% |
| Immigrants | Laos | 4.6 /100 | #222 | Tragic 45.1% |
| Immigrants | Cambodia | 2.7 /100 | #223 | Tragic 44.9% |
| Immigrants | Micronesia | 2.6 /100 | #224 | Tragic 44.9% |
| Dutch West Indians | 2.6 /100 | #225 | Tragic 44.9% |
| Alsatians | 2.3 /100 | #226 | Tragic 44.8% |
Demographics Similar to Paraguayans by Married-couple Households
In terms of married-couple households, the demographic groups most similar to Paraguayans are Icelander (47.0%, a difference of 0.050%), Immigrants from Russia (47.0%, a difference of 0.060%), Immigrants from Bulgaria (47.0%, a difference of 0.10%), Serbian (47.0%, a difference of 0.12%), and Hmong (47.0%, a difference of 0.13%).
| Demographics | Rating | Rank | Married-couple Households |
| Spaniards | 84.1 /100 | #142 | Excellent 47.2% |
| Immigrants | Belarus | 83.8 /100 | #143 | Excellent 47.2% |
| Mexicans | 83.4 /100 | #144 | Excellent 47.1% |
| Slovenes | 81.7 /100 | #145 | Excellent 47.1% |
| Immigrants | Western Europe | 81.6 /100 | #146 | Excellent 47.1% |
| Immigrants | Syria | 81.6 /100 | #147 | Excellent 47.1% |
| Icelanders | 79.5 /100 | #148 | Good 47.0% |
| Paraguayans | 78.7 /100 | #149 | Good 47.0% |
| Immigrants | Russia | 77.6 /100 | #150 | Good 47.0% |
| Immigrants | Bulgaria | 76.8 /100 | #151 | Good 47.0% |
| Serbians | 76.3 /100 | #152 | Good 47.0% |
| Hmong | 76.2 /100 | #153 | Good 47.0% |
| Immigrants | Western Asia | 76.1 /100 | #154 | Good 46.9% |
| Arabs | 76.0 /100 | #155 | Good 46.9% |
| Armenians | 75.4 /100 | #156 | Good 46.9% |