Nicaraguan vs Immigrants from China Married-couple Households
COMPARE
Nicaraguan
Immigrants from China
Married-couple Households
Married-couple Households Comparison
Nicaraguans
Immigrants from China
45.2%
MARRIED-COUPLE HOUSEHOLDS
5.3/ 100
METRIC RATING
219th/ 347
METRIC RANK
48.4%
MARRIED-COUPLE HOUSEHOLDS
98.9/ 100
METRIC RATING
69th/ 347
METRIC RANK
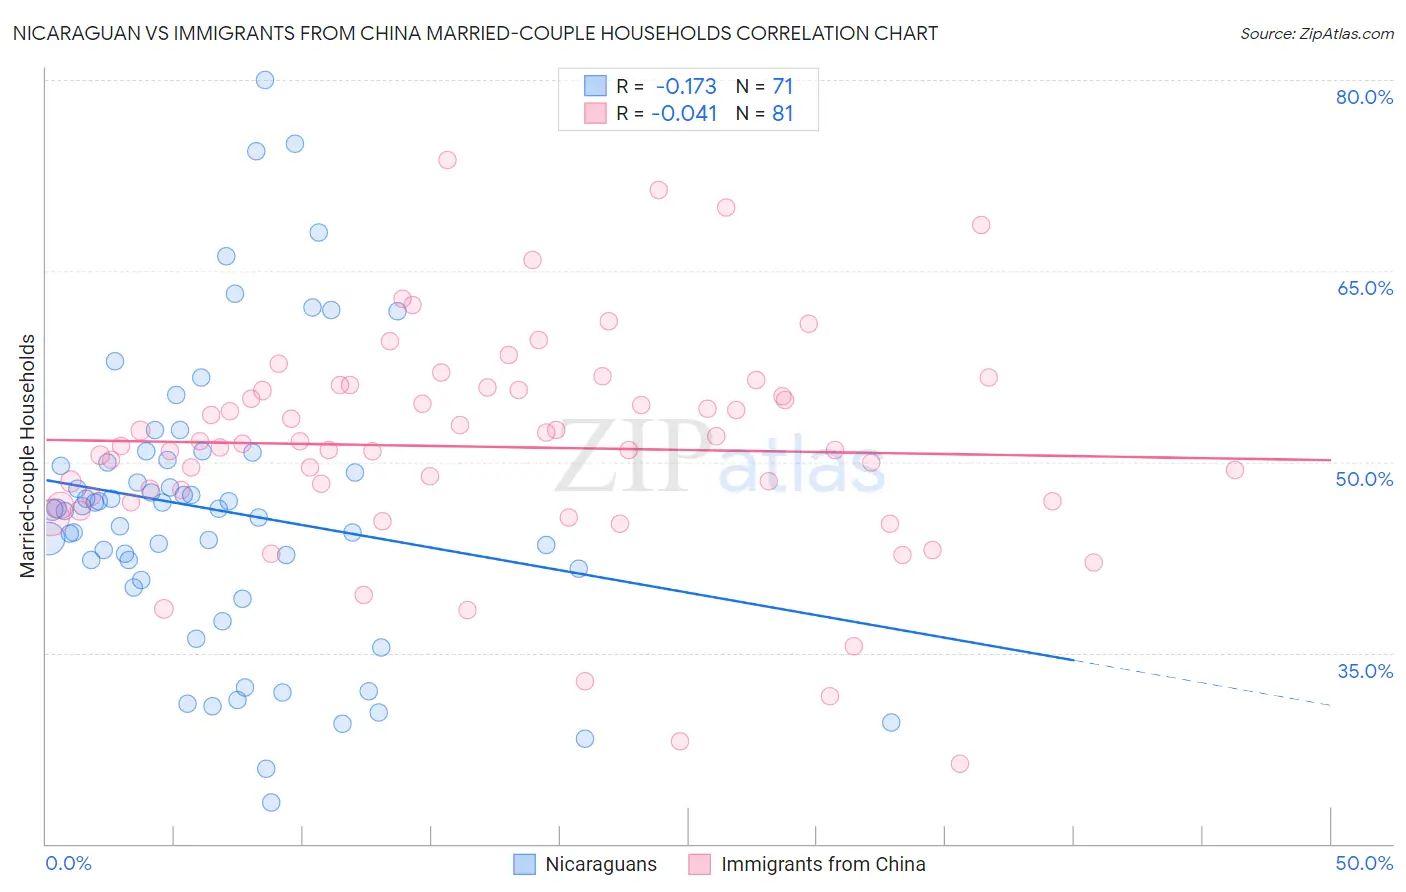
Nicaraguan vs Immigrants from China Married-couple Households Correlation Chart
The statistical analysis conducted on geographies consisting of 285,610,844 people shows a poor negative correlation between the proportion of Nicaraguans and percentage of married-couple family households in the United States with a correlation coefficient (R) of -0.173 and weighted average of 45.2%. Similarly, the statistical analysis conducted on geographies consisting of 456,566,781 people shows no correlation between the proportion of Immigrants from China and percentage of married-couple family households in the United States with a correlation coefficient (R) of -0.041 and weighted average of 48.4%, a difference of 7.1%.
Married-couple Households Correlation Summary
| Measurement | Nicaraguan | Immigrants from China |
| Minimum | 23.2% | 26.3% |
| Maximum | 80.0% | 73.8% |
| Range | 56.8% | 47.4% |
| Mean | 46.2% | 51.2% |
| Median | 46.3% | 51.3% |
| Interquartile 25% (IQ1) | 40.8% | 46.9% |
| Interquartile 75% (IQ3) | 50.2% | 55.7% |
| Interquartile Range (IQR) | 9.4% | 8.8% |
| Standard Deviation (Sample) | 11.4% | 8.7% |
| Standard Deviation (Population) | 11.3% | 8.6% |
Similar Demographics by Married-couple Households
Demographics Similar to Nicaraguans by Married-couple Households
In terms of married-couple households, the demographic groups most similar to Nicaraguans are Immigrants from the Azores (45.2%, a difference of 0.010%), Panamanian (45.2%, a difference of 0.030%), Immigrants from Thailand (45.2%, a difference of 0.030%), Immigrants from Portugal (45.2%, a difference of 0.050%), and Immigrants from Nepal (45.2%, a difference of 0.060%).
| Demographics | Rating | Rank | Married-couple Households |
| Creek | 6.4 /100 | #212 | Tragic 45.3% |
| Yakama | 5.8 /100 | #213 | Tragic 45.2% |
| Japanese | 5.7 /100 | #214 | Tragic 45.2% |
| Immigrants | Nepal | 5.6 /100 | #215 | Tragic 45.2% |
| Immigrants | Portugal | 5.6 /100 | #216 | Tragic 45.2% |
| Panamanians | 5.5 /100 | #217 | Tragic 45.2% |
| Immigrants | Azores | 5.3 /100 | #218 | Tragic 45.2% |
| Nicaraguans | 5.3 /100 | #219 | Tragic 45.2% |
| Immigrants | Thailand | 5.1 /100 | #220 | Tragic 45.2% |
| Tlingit-Haida | 4.9 /100 | #221 | Tragic 45.1% |
| Immigrants | Laos | 4.6 /100 | #222 | Tragic 45.1% |
| Immigrants | Cambodia | 2.7 /100 | #223 | Tragic 44.9% |
| Immigrants | Micronesia | 2.6 /100 | #224 | Tragic 44.9% |
| Dutch West Indians | 2.6 /100 | #225 | Tragic 44.9% |
| Alsatians | 2.3 /100 | #226 | Tragic 44.8% |
Demographics Similar to Immigrants from China by Married-couple Households
In terms of married-couple households, the demographic groups most similar to Immigrants from China are Immigrants from South Eastern Asia (48.4%, a difference of 0.0%), Romanian (48.4%, a difference of 0.010%), Jordanian (48.4%, a difference of 0.020%), Immigrants from Canada (48.4%, a difference of 0.040%), and Immigrants from North America (48.4%, a difference of 0.040%).
| Demographics | Rating | Rank | Married-couple Households |
| Luxembourgers | 99.1 /100 | #62 | Exceptional 48.5% |
| Basques | 99.0 /100 | #63 | Exceptional 48.4% |
| Northern Europeans | 99.0 /100 | #64 | Exceptional 48.4% |
| Immigrants | Canada | 99.0 /100 | #65 | Exceptional 48.4% |
| Jordanians | 98.9 /100 | #66 | Exceptional 48.4% |
| Romanians | 98.9 /100 | #67 | Exceptional 48.4% |
| Immigrants | South Eastern Asia | 98.9 /100 | #68 | Exceptional 48.4% |
| Immigrants | China | 98.9 /100 | #69 | Exceptional 48.4% |
| Immigrants | North America | 98.9 /100 | #70 | Exceptional 48.4% |
| Laotians | 98.8 /100 | #71 | Exceptional 48.4% |
| Scotch-Irish | 98.6 /100 | #72 | Exceptional 48.3% |
| Immigrants | Singapore | 98.6 /100 | #73 | Exceptional 48.3% |
| Immigrants | Romania | 98.6 /100 | #74 | Exceptional 48.3% |
| Immigrants | England | 98.4 /100 | #75 | Exceptional 48.2% |
| Immigrants | Fiji | 98.4 /100 | #76 | Exceptional 48.2% |