Nicaraguan vs Immigrants from South Central Asia Births to Unmarried Women
COMPARE
Nicaraguan
Immigrants from South Central Asia
Births to Unmarried Women
Births to Unmarried Women Comparison
Nicaraguans
Immigrants from South Central Asia
36.6%
BIRTHS TO UNMARRIED WOMEN
0.1/ 100
METRIC RATING
263rd/ 347
METRIC RANK
24.7%
BIRTHS TO UNMARRIED WOMEN
100.0/ 100
METRIC RATING
9th/ 347
METRIC RANK
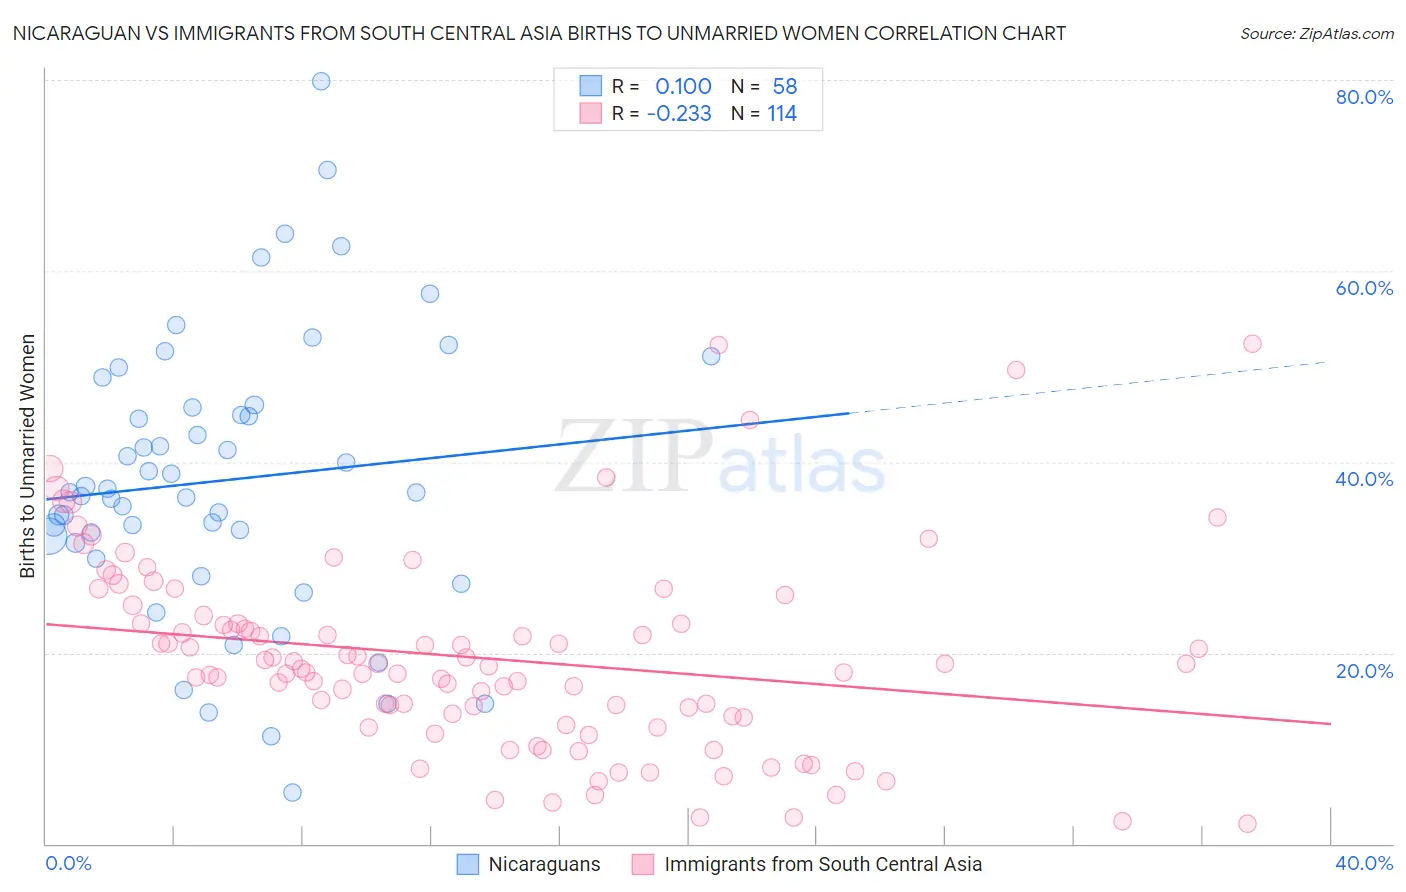
Nicaraguan vs Immigrants from South Central Asia Births to Unmarried Women Correlation Chart
The statistical analysis conducted on geographies consisting of 275,370,384 people shows a slight positive correlation between the proportion of Nicaraguans and percentage of births to unmarried women in the United States with a correlation coefficient (R) of 0.100 and weighted average of 36.6%. Similarly, the statistical analysis conducted on geographies consisting of 435,679,472 people shows a weak negative correlation between the proportion of Immigrants from South Central Asia and percentage of births to unmarried women in the United States with a correlation coefficient (R) of -0.233 and weighted average of 24.7%, a difference of 48.3%.
Births to Unmarried Women Correlation Summary
| Measurement | Nicaraguan | Immigrants from South Central Asia |
| Minimum | 5.4% | 2.1% |
| Maximum | 79.8% | 52.4% |
| Range | 74.4% | 50.3% |
| Mean | 38.1% | 19.5% |
| Median | 36.8% | 18.4% |
| Interquartile 25% (IQ1) | 31.5% | 13.2% |
| Interquartile 75% (IQ3) | 45.7% | 23.1% |
| Interquartile Range (IQR) | 14.2% | 9.9% |
| Standard Deviation (Sample) | 14.7% | 10.2% |
| Standard Deviation (Population) | 14.6% | 10.2% |
Similar Demographics by Births to Unmarried Women
Demographics Similar to Nicaraguans by Births to Unmarried Women
In terms of births to unmarried women, the demographic groups most similar to Nicaraguans are French American Indian (36.6%, a difference of 0.020%), Subsaharan African (36.7%, a difference of 0.12%), Cherokee (36.7%, a difference of 0.17%), Immigrants from Senegal (36.7%, a difference of 0.22%), and Central American (36.7%, a difference of 0.29%).
| Demographics | Rating | Rank | Births to Unmarried Women |
| Immigrants | Trinidad and Tobago | 0.2 /100 | #256 | Tragic 36.3% |
| Immigrants | Grenada | 0.2 /100 | #257 | Tragic 36.3% |
| Americans | 0.2 /100 | #258 | Tragic 36.4% |
| Immigrants | El Salvador | 0.2 /100 | #259 | Tragic 36.4% |
| Ottawa | 0.2 /100 | #260 | Tragic 36.5% |
| Trinidadians and Tobagonians | 0.2 /100 | #261 | Tragic 36.5% |
| French American Indians | 0.1 /100 | #262 | Tragic 36.6% |
| Nicaraguans | 0.1 /100 | #263 | Tragic 36.6% |
| Sub-Saharan Africans | 0.1 /100 | #264 | Tragic 36.7% |
| Cherokee | 0.1 /100 | #265 | Tragic 36.7% |
| Immigrants | Senegal | 0.1 /100 | #266 | Tragic 36.7% |
| Central Americans | 0.1 /100 | #267 | Tragic 36.7% |
| Comanche | 0.1 /100 | #268 | Tragic 36.7% |
| Senegalese | 0.1 /100 | #269 | Tragic 36.8% |
| Immigrants | Congo | 0.1 /100 | #270 | Tragic 36.8% |
Demographics Similar to Immigrants from South Central Asia by Births to Unmarried Women
In terms of births to unmarried women, the demographic groups most similar to Immigrants from South Central Asia are Immigrants from China (24.7%, a difference of 0.010%), Immigrants from Eastern Asia (25.0%, a difference of 1.5%), Immigrants from Israel (25.1%, a difference of 1.9%), Indian (Asian) (25.3%, a difference of 2.4%), and Iranian (25.3%, a difference of 2.5%).
| Demographics | Rating | Rank | Births to Unmarried Women |
| Immigrants | India | 100.0 /100 | #2 | Exceptional 22.9% |
| Filipinos | 100.0 /100 | #3 | Exceptional 23.0% |
| Immigrants | Taiwan | 100.0 /100 | #4 | Exceptional 23.0% |
| Immigrants | Hong Kong | 100.0 /100 | #5 | Exceptional 23.6% |
| Immigrants | Iran | 100.0 /100 | #6 | Exceptional 24.0% |
| Thais | 100.0 /100 | #7 | Exceptional 24.0% |
| Immigrants | China | 100.0 /100 | #8 | Exceptional 24.7% |
| Immigrants | South Central Asia | 100.0 /100 | #9 | Exceptional 24.7% |
| Immigrants | Eastern Asia | 100.0 /100 | #10 | Exceptional 25.0% |
| Immigrants | Israel | 100.0 /100 | #11 | Exceptional 25.1% |
| Indians (Asian) | 100.0 /100 | #12 | Exceptional 25.3% |
| Iranians | 100.0 /100 | #13 | Exceptional 25.3% |
| Immigrants | Lebanon | 100.0 /100 | #14 | Exceptional 25.3% |
| Immigrants | Singapore | 100.0 /100 | #15 | Exceptional 25.6% |
| Immigrants | Belarus | 100.0 /100 | #16 | Exceptional 25.6% |