Nepalese vs Samoan No Vehicles in Household
COMPARE
Nepalese
Samoan
No Vehicles in Household
No Vehicles in Household Comparison
Nepalese
Samoans
7.4%
NO VEHICLES IN HOUSEHOLD
100.0/ 100
METRIC RATING
21st/ 347
METRIC RANK
7.6%
NO VEHICLES IN HOUSEHOLD
100.0/ 100
METRIC RATING
28th/ 347
METRIC RANK
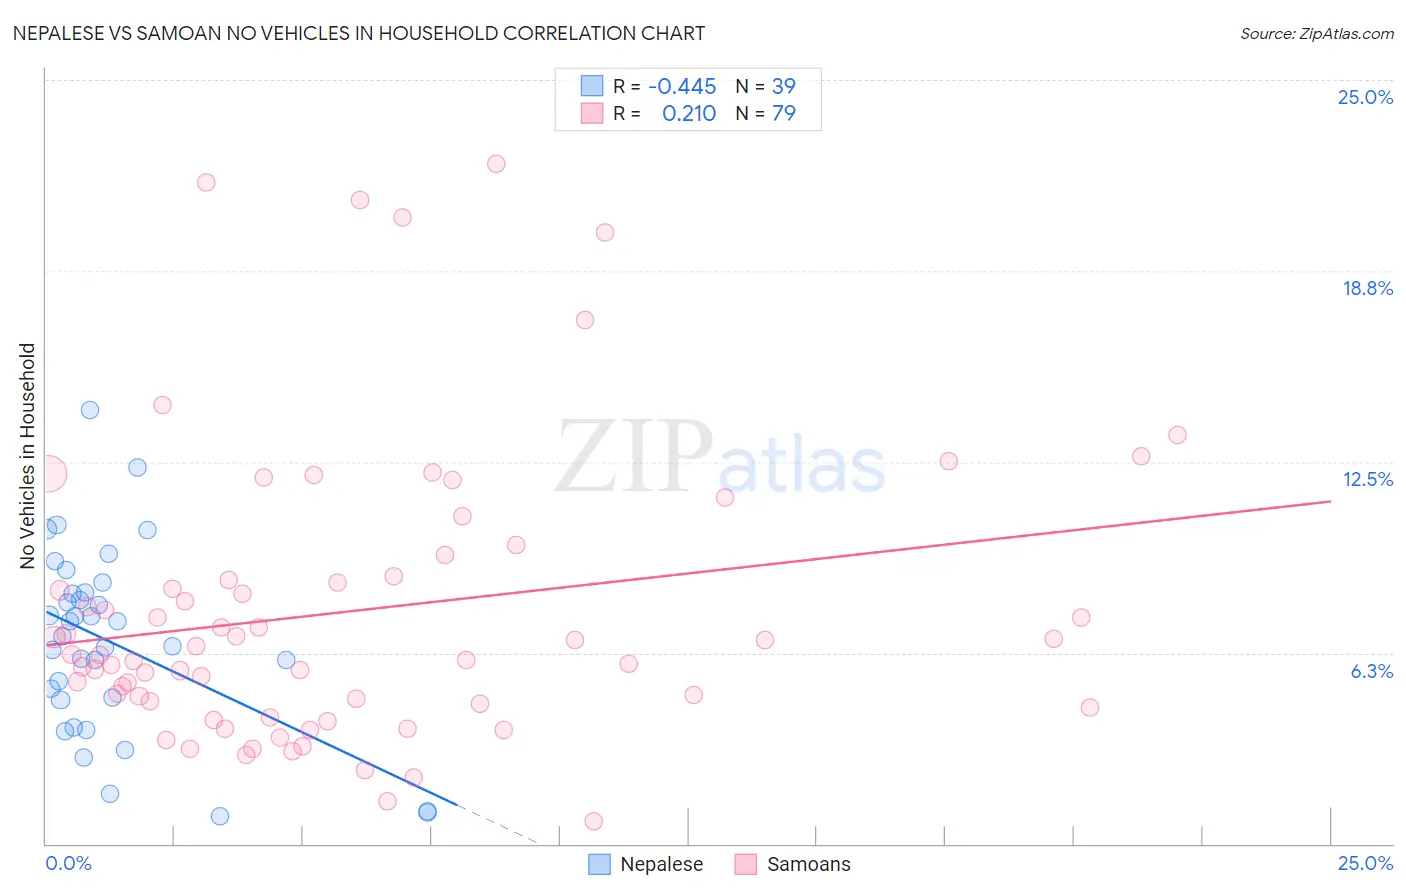
Nepalese vs Samoan No Vehicles in Household Correlation Chart
The statistical analysis conducted on geographies consisting of 24,476,929 people shows a moderate negative correlation between the proportion of Nepalese and percentage of households with no vehicle available in the United States with a correlation coefficient (R) of -0.445 and weighted average of 7.4%. Similarly, the statistical analysis conducted on geographies consisting of 224,864,894 people shows a weak positive correlation between the proportion of Samoans and percentage of households with no vehicle available in the United States with a correlation coefficient (R) of 0.210 and weighted average of 7.6%, a difference of 3.2%.
No Vehicles in Household Correlation Summary
| Measurement | Nepalese | Samoan |
| Minimum | 0.89% | 0.73% |
| Maximum | 14.2% | 22.3% |
| Range | 13.3% | 21.5% |
| Mean | 6.6% | 7.6% |
| Median | 6.8% | 6.2% |
| Interquartile 25% (IQ1) | 4.7% | 4.6% |
| Interquartile 75% (IQ3) | 8.2% | 8.8% |
| Interquartile Range (IQR) | 3.5% | 4.2% |
| Standard Deviation (Sample) | 3.0% | 4.8% |
| Standard Deviation (Population) | 3.0% | 4.7% |
Demographics Similar to Nepalese and Samoans by No Vehicles in Household
In terms of no vehicles in household, the demographic groups most similar to Nepalese are Ottawa (7.4%, a difference of 0.15%), Arapaho (7.4%, a difference of 0.57%), Irish (7.4%, a difference of 0.60%), French (7.4%, a difference of 0.65%), and Immigrants from Iraq (7.5%, a difference of 1.0%). Similarly, the demographic groups most similar to Samoans are American (7.7%, a difference of 0.29%), British (7.6%, a difference of 0.55%), Finnish (7.7%, a difference of 0.59%), Sri Lankan (7.6%, a difference of 0.60%), and Native Hawaiian (7.7%, a difference of 0.74%).
| Demographics | Rating | Rank | No Vehicles in Household |
| Mexicans | 100.0 /100 | #14 | Exceptional 7.0% |
| Whites/Caucasians | 100.0 /100 | #15 | Exceptional 7.0% |
| Europeans | 100.0 /100 | #16 | Exceptional 7.1% |
| Welsh | 100.0 /100 | #17 | Exceptional 7.2% |
| Tongans | 100.0 /100 | #18 | Exceptional 7.2% |
| Arapaho | 100.0 /100 | #19 | Exceptional 7.4% |
| Ottawa | 100.0 /100 | #20 | Exceptional 7.4% |
| Nepalese | 100.0 /100 | #21 | Exceptional 7.4% |
| Irish | 100.0 /100 | #22 | Exceptional 7.4% |
| French | 100.0 /100 | #23 | Exceptional 7.4% |
| Immigrants | Iraq | 100.0 /100 | #24 | Exceptional 7.5% |
| Yaqui | 100.0 /100 | #25 | Exceptional 7.5% |
| Sri Lankans | 100.0 /100 | #26 | Exceptional 7.6% |
| British | 100.0 /100 | #27 | Exceptional 7.6% |
| Samoans | 100.0 /100 | #28 | Exceptional 7.6% |
| Americans | 100.0 /100 | #29 | Exceptional 7.7% |
| Finns | 100.0 /100 | #30 | Exceptional 7.7% |
| Native Hawaiians | 100.0 /100 | #31 | Exceptional 7.7% |
| Malaysians | 100.0 /100 | #32 | Exceptional 7.7% |
| Immigrants | Taiwan | 100.0 /100 | #33 | Exceptional 7.7% |
| Immigrants | Vietnam | 100.0 /100 | #34 | Exceptional 7.7% |