Swedish vs Austrian Single Father Households
COMPARE
Swedish
Austrian
Single Father Households
Single Father Households Comparison
Swedes
Austrians
2.3%
SINGLE FATHER HOUSEHOLDS
61.6/ 100
METRIC RATING
171st/ 347
METRIC RANK
2.2%
SINGLE FATHER HOUSEHOLDS
94.2/ 100
METRIC RATING
137th/ 347
METRIC RANK
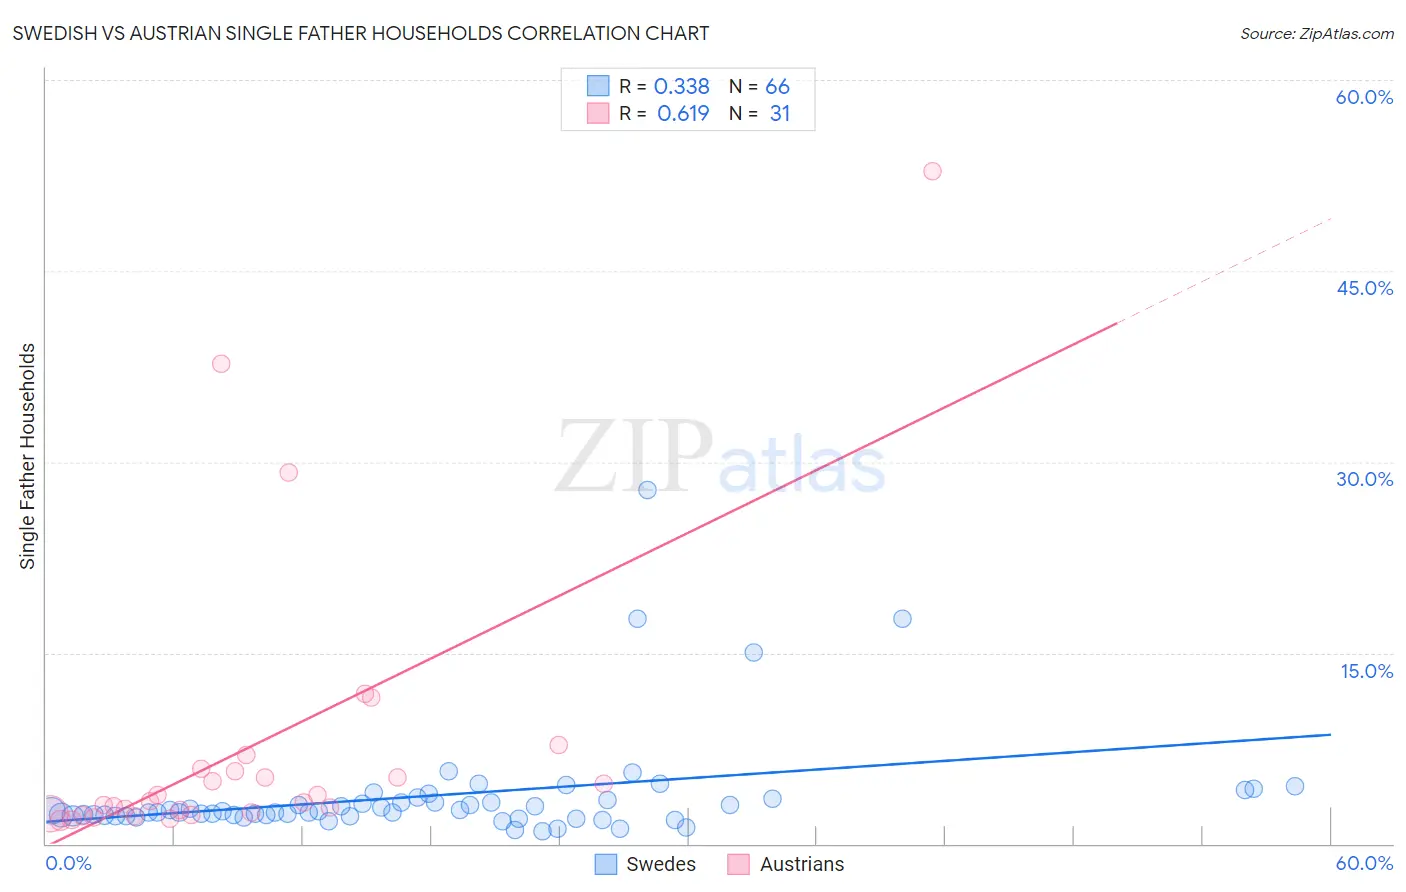
Swedish vs Austrian Single Father Households Correlation Chart
The statistical analysis conducted on geographies consisting of 527,613,480 people shows a mild positive correlation between the proportion of Swedes and percentage of single father households in the United States with a correlation coefficient (R) of 0.338 and weighted average of 2.3%. Similarly, the statistical analysis conducted on geographies consisting of 445,997,732 people shows a significant positive correlation between the proportion of Austrians and percentage of single father households in the United States with a correlation coefficient (R) of 0.619 and weighted average of 2.2%, a difference of 4.5%.
Single Father Households Correlation Summary
| Measurement | Swedish | Austrian |
| Minimum | 0.93% | 1.8% |
| Maximum | 27.8% | 52.8% |
| Range | 26.8% | 51.0% |
| Mean | 3.8% | 7.7% |
| Median | 2.5% | 3.4% |
| Interquartile 25% (IQ1) | 2.2% | 2.3% |
| Interquartile 75% (IQ3) | 3.5% | 5.9% |
| Interquartile Range (IQR) | 1.3% | 3.6% |
| Standard Deviation (Sample) | 4.3% | 11.4% |
| Standard Deviation (Population) | 4.3% | 11.3% |
Similar Demographics by Single Father Households
Demographics Similar to Swedes by Single Father Households
In terms of single father households, the demographic groups most similar to Swedes are Ugandan (2.3%, a difference of 0.050%), Czech (2.3%, a difference of 0.070%), Icelander (2.3%, a difference of 0.12%), South American (2.3%, a difference of 0.21%), and Czechoslovakian (2.3%, a difference of 0.21%).
| Demographics | Rating | Rank | Single Father Households |
| Pakistanis | 70.6 /100 | #164 | Good 2.3% |
| Scotch-Irish | 69.4 /100 | #165 | Good 2.3% |
| English | 68.6 /100 | #166 | Good 2.3% |
| South Americans | 64.3 /100 | #167 | Good 2.3% |
| Icelanders | 63.1 /100 | #168 | Good 2.3% |
| Czechs | 62.5 /100 | #169 | Good 2.3% |
| Ugandans | 62.2 /100 | #170 | Good 2.3% |
| Swedes | 61.6 /100 | #171 | Good 2.3% |
| Czechoslovakians | 58.9 /100 | #172 | Average 2.3% |
| Celtics | 55.4 /100 | #173 | Average 2.3% |
| Afghans | 50.0 /100 | #174 | Average 2.3% |
| Immigrants | Jamaica | 49.1 /100 | #175 | Average 2.3% |
| Danes | 48.2 /100 | #176 | Average 2.3% |
| Colombians | 48.0 /100 | #177 | Average 2.3% |
| Costa Ricans | 44.1 /100 | #178 | Average 2.3% |
Demographics Similar to Austrians by Single Father Households
In terms of single father households, the demographic groups most similar to Austrians are West Indian (2.2%, a difference of 0.030%), Chilean (2.2%, a difference of 0.11%), Syrian (2.2%, a difference of 0.23%), Zimbabwean (2.2%, a difference of 0.34%), and Brazilian (2.2%, a difference of 0.45%).
| Demographics | Rating | Rank | Single Father Households |
| Immigrants | Chile | 96.7 /100 | #130 | Exceptional 2.2% |
| Immigrants | Jordan | 96.6 /100 | #131 | Exceptional 2.2% |
| Poles | 96.5 /100 | #132 | Exceptional 2.2% |
| Taiwanese | 96.3 /100 | #133 | Exceptional 2.2% |
| Zimbabweans | 95.1 /100 | #134 | Exceptional 2.2% |
| Syrians | 94.8 /100 | #135 | Exceptional 2.2% |
| Chileans | 94.5 /100 | #136 | Exceptional 2.2% |
| Austrians | 94.2 /100 | #137 | Exceptional 2.2% |
| West Indians | 94.1 /100 | #138 | Exceptional 2.2% |
| Brazilians | 92.8 /100 | #139 | Exceptional 2.2% |
| British | 92.8 /100 | #140 | Exceptional 2.2% |
| Laotians | 92.5 /100 | #141 | Exceptional 2.2% |
| Luxembourgers | 92.3 /100 | #142 | Exceptional 2.2% |
| Immigrants | Nepal | 92.1 /100 | #143 | Exceptional 2.2% |
| Slovaks | 90.7 /100 | #144 | Exceptional 2.2% |