Arab vs Austrian Single Father Households
COMPARE
Arab
Austrian
Single Father Households
Single Father Households Comparison
Arabs
Austrians
2.1%
SINGLE FATHER HOUSEHOLDS
99.2/ 100
METRIC RATING
96th/ 347
METRIC RANK
2.2%
SINGLE FATHER HOUSEHOLDS
94.2/ 100
METRIC RATING
137th/ 347
METRIC RANK
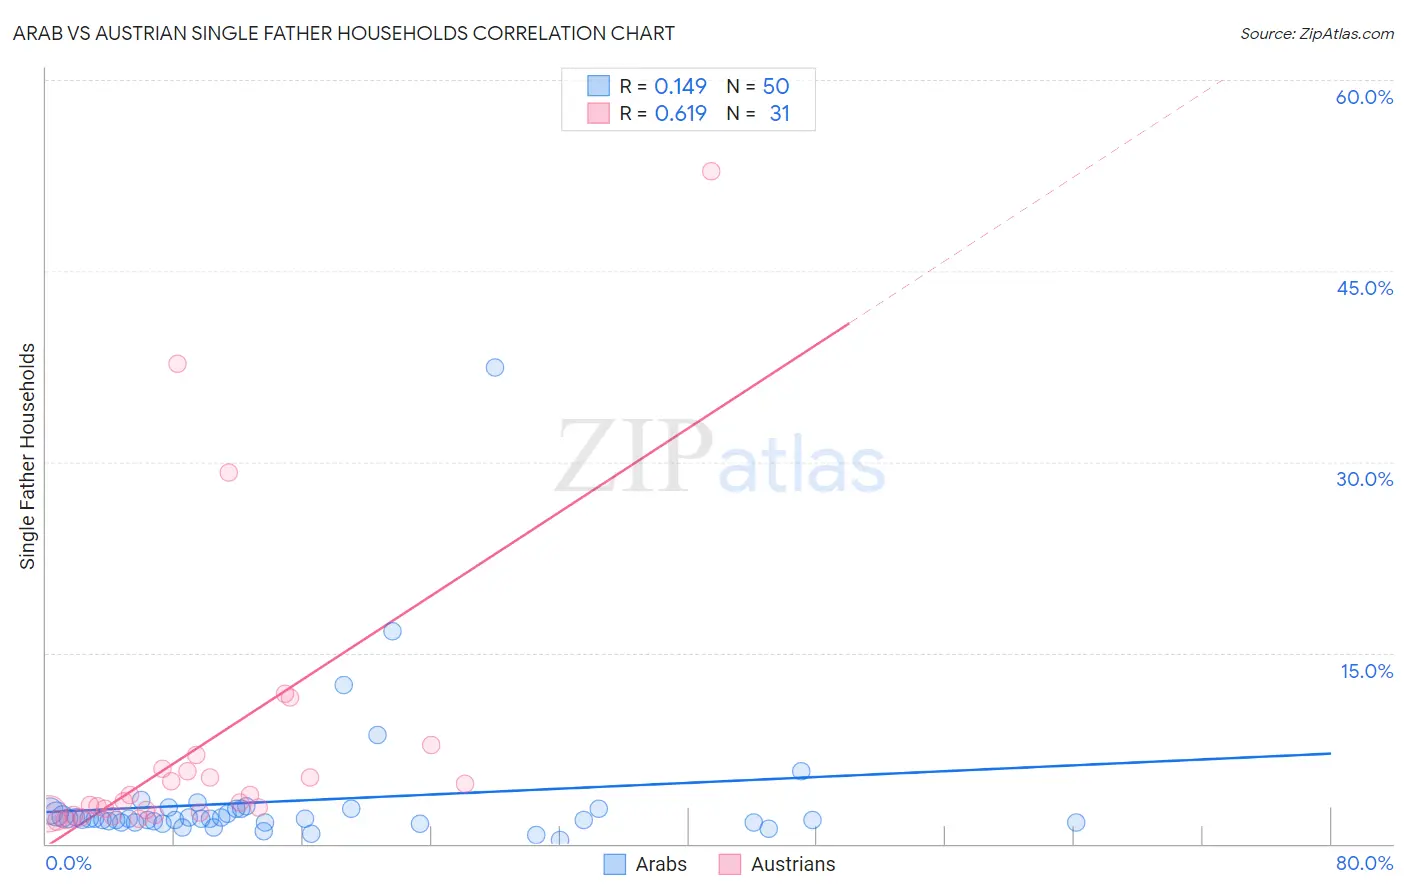
Arab vs Austrian Single Father Households Correlation Chart
The statistical analysis conducted on geographies consisting of 480,579,440 people shows a poor positive correlation between the proportion of Arabs and percentage of single father households in the United States with a correlation coefficient (R) of 0.149 and weighted average of 2.1%. Similarly, the statistical analysis conducted on geographies consisting of 445,997,732 people shows a significant positive correlation between the proportion of Austrians and percentage of single father households in the United States with a correlation coefficient (R) of 0.619 and weighted average of 2.2%, a difference of 4.1%.
Single Father Households Correlation Summary
| Measurement | Arab | Austrian |
| Minimum | 0.25% | 1.8% |
| Maximum | 37.5% | 52.8% |
| Range | 37.2% | 51.0% |
| Mean | 3.4% | 7.7% |
| Median | 2.0% | 3.4% |
| Interquartile 25% (IQ1) | 1.7% | 2.3% |
| Interquartile 75% (IQ3) | 2.7% | 5.9% |
| Interquartile Range (IQR) | 1.0% | 3.6% |
| Standard Deviation (Sample) | 5.6% | 11.4% |
| Standard Deviation (Population) | 5.6% | 11.3% |
Similar Demographics by Single Father Households
Demographics Similar to Arabs by Single Father Households
In terms of single father households, the demographic groups most similar to Arabs are Immigrants from Moldova (2.1%, a difference of 0.13%), Bermudan (2.1%, a difference of 0.14%), Guyanese (2.1%, a difference of 0.25%), South African (2.1%, a difference of 0.30%), and Croatian (2.1%, a difference of 0.37%).
| Demographics | Rating | Rank | Single Father Households |
| Immigrants | Armenia | 99.5 /100 | #89 | Exceptional 2.1% |
| Immigrants | Pakistan | 99.5 /100 | #90 | Exceptional 2.1% |
| Immigrants | Guyana | 99.4 /100 | #91 | Exceptional 2.1% |
| Romanians | 99.4 /100 | #92 | Exceptional 2.1% |
| Croatians | 99.3 /100 | #93 | Exceptional 2.1% |
| Ukrainians | 99.3 /100 | #94 | Exceptional 2.1% |
| Bermudans | 99.2 /100 | #95 | Exceptional 2.1% |
| Arabs | 99.2 /100 | #96 | Exceptional 2.1% |
| Immigrants | Moldova | 99.1 /100 | #97 | Exceptional 2.1% |
| Guyanese | 99.1 /100 | #98 | Exceptional 2.1% |
| South Africans | 99.1 /100 | #99 | Exceptional 2.1% |
| Immigrants | Northern Africa | 99.0 /100 | #100 | Exceptional 2.1% |
| Immigrants | Western Europe | 98.9 /100 | #101 | Exceptional 2.1% |
| Argentineans | 98.9 /100 | #102 | Exceptional 2.1% |
| Lebanese | 98.9 /100 | #103 | Exceptional 2.1% |
Demographics Similar to Austrians by Single Father Households
In terms of single father households, the demographic groups most similar to Austrians are West Indian (2.2%, a difference of 0.030%), Chilean (2.2%, a difference of 0.11%), Syrian (2.2%, a difference of 0.23%), Zimbabwean (2.2%, a difference of 0.34%), and Brazilian (2.2%, a difference of 0.45%).
| Demographics | Rating | Rank | Single Father Households |
| Immigrants | Chile | 96.7 /100 | #130 | Exceptional 2.2% |
| Immigrants | Jordan | 96.6 /100 | #131 | Exceptional 2.2% |
| Poles | 96.5 /100 | #132 | Exceptional 2.2% |
| Taiwanese | 96.3 /100 | #133 | Exceptional 2.2% |
| Zimbabweans | 95.1 /100 | #134 | Exceptional 2.2% |
| Syrians | 94.8 /100 | #135 | Exceptional 2.2% |
| Chileans | 94.5 /100 | #136 | Exceptional 2.2% |
| Austrians | 94.2 /100 | #137 | Exceptional 2.2% |
| West Indians | 94.1 /100 | #138 | Exceptional 2.2% |
| Brazilians | 92.8 /100 | #139 | Exceptional 2.2% |
| British | 92.8 /100 | #140 | Exceptional 2.2% |
| Laotians | 92.5 /100 | #141 | Exceptional 2.2% |
| Luxembourgers | 92.3 /100 | #142 | Exceptional 2.2% |
| Immigrants | Nepal | 92.1 /100 | #143 | Exceptional 2.2% |
| Slovaks | 90.7 /100 | #144 | Exceptional 2.2% |