Immigrants from Serbia vs Welsh Married-couple Households
COMPARE
Immigrants from Serbia
Welsh
Married-couple Households
Married-couple Households Comparison
Immigrants from Serbia
Welsh
45.7%
MARRIED-COUPLE HOUSEHOLDS
15.2/ 100
METRIC RATING
201st/ 347
METRIC RANK
48.8%
MARRIED-COUPLE HOUSEHOLDS
99.5/ 100
METRIC RATING
44th/ 347
METRIC RANK
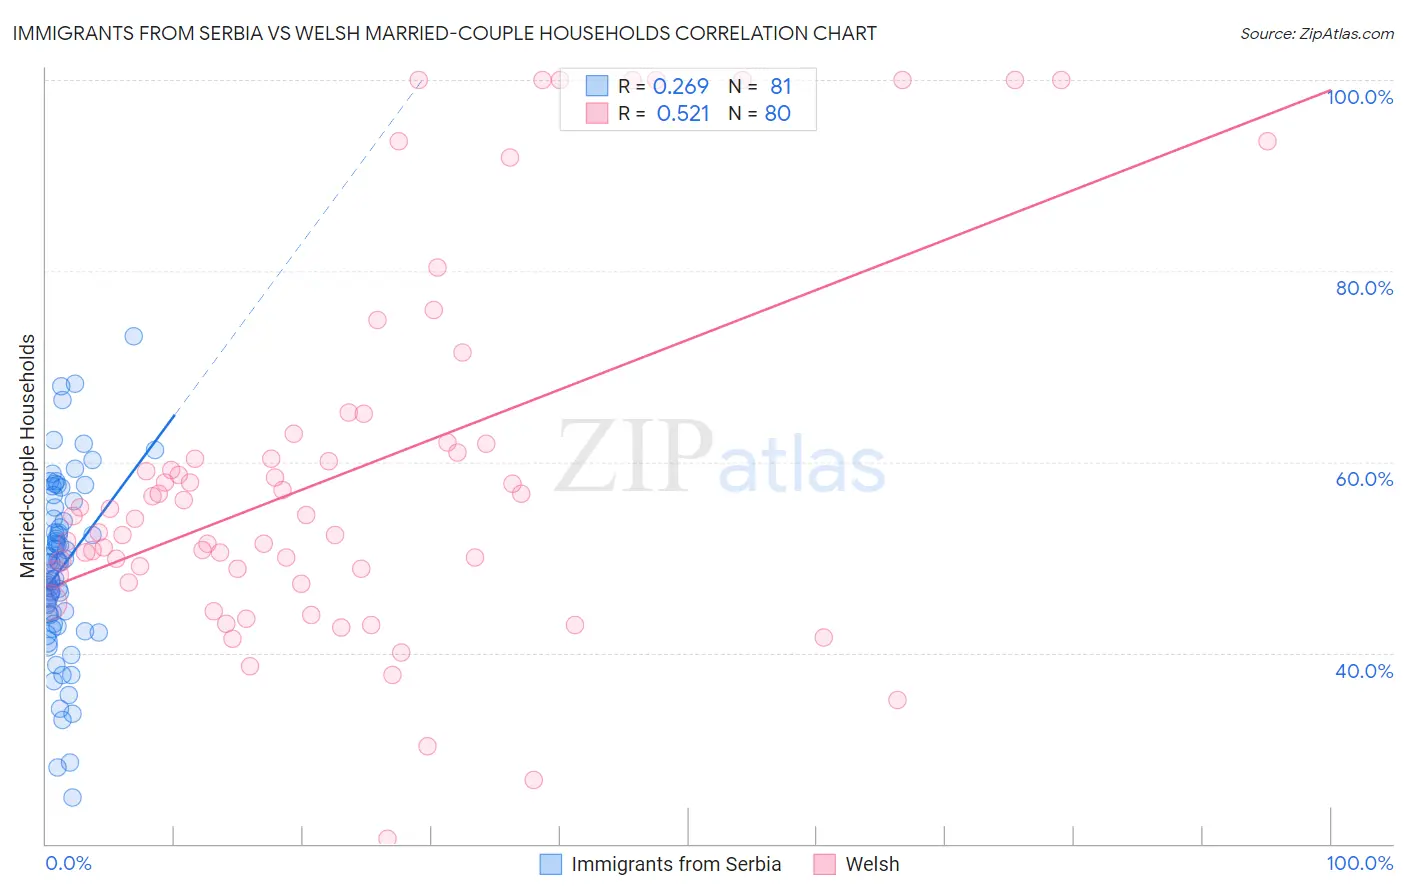
Immigrants from Serbia vs Welsh Married-couple Households Correlation Chart
The statistical analysis conducted on geographies consisting of 131,726,431 people shows a weak positive correlation between the proportion of Immigrants from Serbia and percentage of married-couple family households in the United States with a correlation coefficient (R) of 0.269 and weighted average of 45.7%. Similarly, the statistical analysis conducted on geographies consisting of 528,152,714 people shows a substantial positive correlation between the proportion of Welsh and percentage of married-couple family households in the United States with a correlation coefficient (R) of 0.521 and weighted average of 48.8%, a difference of 6.8%.
Married-couple Households Correlation Summary
| Measurement | Immigrants from Serbia | Welsh |
| Minimum | 24.8% | 20.5% |
| Maximum | 73.1% | 100.0% |
| Range | 48.3% | 79.5% |
| Mean | 48.9% | 59.0% |
| Median | 49.5% | 54.3% |
| Interquartile 25% (IQ1) | 43.5% | 48.5% |
| Interquartile 75% (IQ3) | 54.6% | 62.0% |
| Interquartile Range (IQR) | 11.1% | 13.5% |
| Standard Deviation (Sample) | 9.2% | 19.3% |
| Standard Deviation (Population) | 9.1% | 19.2% |
Similar Demographics by Married-couple Households
Demographics Similar to Immigrants from Serbia by Married-couple Households
In terms of married-couple households, the demographic groups most similar to Immigrants from Serbia are Potawatomi (45.7%, a difference of 0.030%), Carpatho Rusyn (45.7%, a difference of 0.040%), Immigrants from Central America (45.7%, a difference of 0.080%), Alaska Native (45.6%, a difference of 0.17%), and Aleut (45.6%, a difference of 0.22%).
| Demographics | Rating | Rank | Married-couple Households |
| Mexican American Indians | 23.3 /100 | #194 | Fair 45.9% |
| Chickasaw | 22.7 /100 | #195 | Fair 45.9% |
| Immigrants | South America | 22.2 /100 | #196 | Fair 45.9% |
| Cambodians | 21.3 /100 | #197 | Fair 45.9% |
| Ottawa | 19.4 /100 | #198 | Poor 45.8% |
| Carpatho Rusyns | 15.7 /100 | #199 | Poor 45.7% |
| Potawatomi | 15.6 /100 | #200 | Poor 45.7% |
| Immigrants | Serbia | 15.2 /100 | #201 | Poor 45.7% |
| Immigrants | Central America | 14.2 /100 | #202 | Poor 45.7% |
| Alaska Natives | 13.0 /100 | #203 | Poor 45.6% |
| Aleuts | 12.5 /100 | #204 | Poor 45.6% |
| Nepalese | 11.9 /100 | #205 | Poor 45.6% |
| Uruguayans | 10.4 /100 | #206 | Poor 45.5% |
| Immigrants | France | 8.8 /100 | #207 | Tragic 45.4% |
| Hispanics or Latinos | 8.7 /100 | #208 | Tragic 45.4% |
Demographics Similar to Welsh by Married-couple Households
In terms of married-couple households, the demographic groups most similar to Welsh are Immigrants from Eastern Asia (48.8%, a difference of 0.030%), Immigrants from Iran (48.8%, a difference of 0.050%), Tsimshian (48.7%, a difference of 0.080%), Immigrants from Vietnam (48.8%, a difference of 0.10%), and British (48.7%, a difference of 0.10%).
| Demographics | Rating | Rank | Married-couple Households |
| Sri Lankans | 99.7 /100 | #37 | Exceptional 49.0% |
| Greeks | 99.7 /100 | #38 | Exceptional 48.9% |
| Lithuanians | 99.6 /100 | #39 | Exceptional 48.9% |
| Immigrants | Bolivia | 99.6 /100 | #40 | Exceptional 48.9% |
| Immigrants | Lebanon | 99.6 /100 | #41 | Exceptional 48.9% |
| Immigrants | Vietnam | 99.6 /100 | #42 | Exceptional 48.8% |
| Immigrants | Iran | 99.6 /100 | #43 | Exceptional 48.8% |
| Welsh | 99.5 /100 | #44 | Exceptional 48.8% |
| Immigrants | Eastern Asia | 99.5 /100 | #45 | Exceptional 48.8% |
| Tsimshian | 99.5 /100 | #46 | Exceptional 48.7% |
| British | 99.5 /100 | #47 | Exceptional 48.7% |
| Indians (Asian) | 99.4 /100 | #48 | Exceptional 48.7% |
| Immigrants | Sri Lanka | 99.4 /100 | #49 | Exceptional 48.7% |
| Samoans | 99.4 /100 | #50 | Exceptional 48.7% |
| Eastern Europeans | 99.3 /100 | #51 | Exceptional 48.6% |