Guyanese vs Puerto Rican Single Father Households
COMPARE
Guyanese
Puerto Rican
Single Father Households
Single Father Households Comparison
Guyanese
Puerto Ricans
2.1%
SINGLE FATHER HOUSEHOLDS
99.1/ 100
METRIC RATING
98th/ 347
METRIC RANK
2.6%
SINGLE FATHER HOUSEHOLDS
0.2/ 100
METRIC RATING
274th/ 347
METRIC RANK
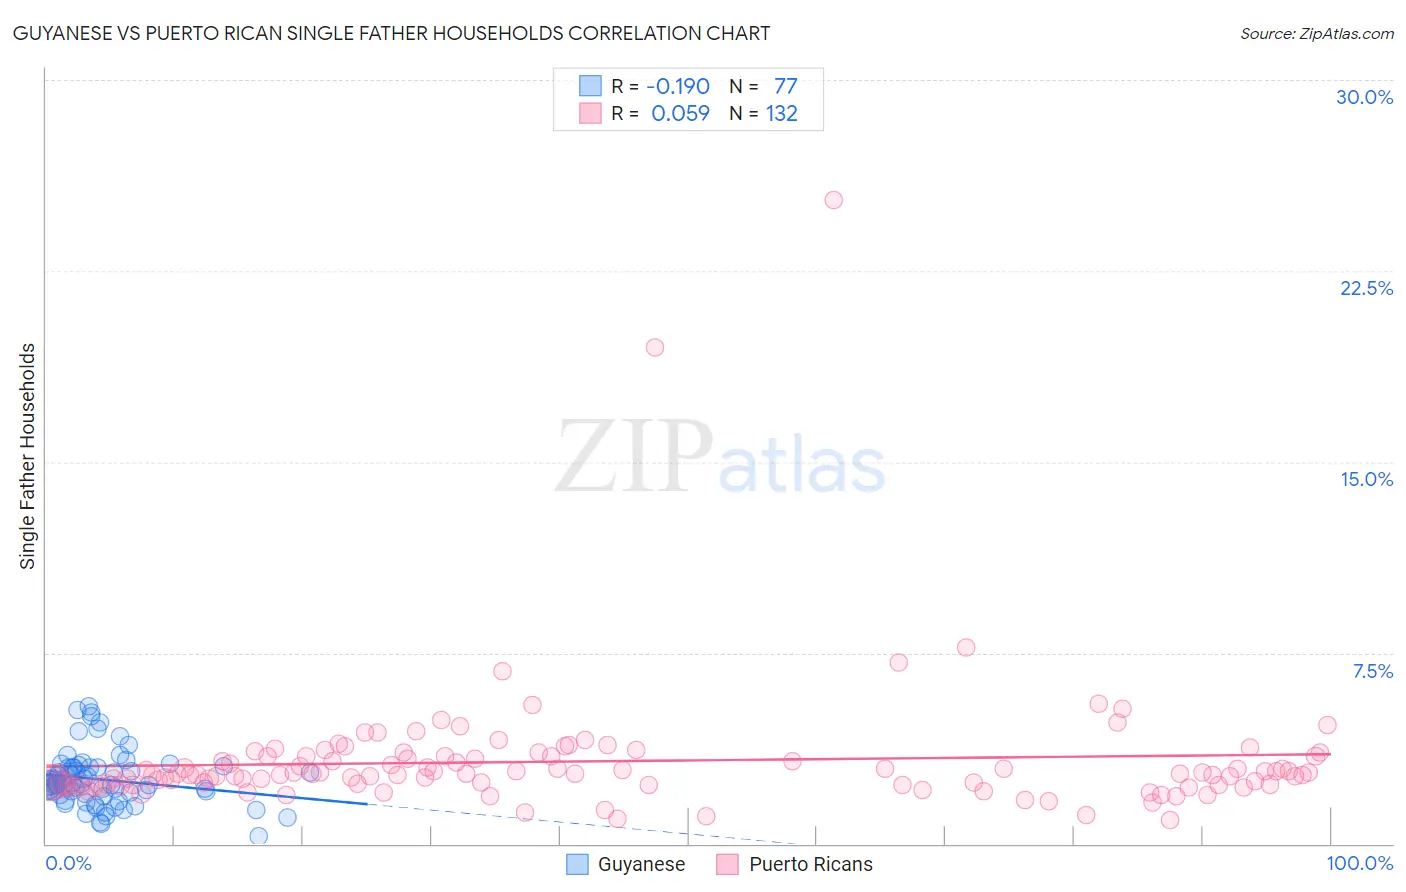
Guyanese vs Puerto Rican Single Father Households Correlation Chart
The statistical analysis conducted on geographies consisting of 176,087,716 people shows a poor negative correlation between the proportion of Guyanese and percentage of single father households in the United States with a correlation coefficient (R) of -0.190 and weighted average of 2.1%. Similarly, the statistical analysis conducted on geographies consisting of 519,503,962 people shows a slight positive correlation between the proportion of Puerto Ricans and percentage of single father households in the United States with a correlation coefficient (R) of 0.059 and weighted average of 2.6%, a difference of 21.9%.
Single Father Households Correlation Summary
| Measurement | Guyanese | Puerto Rican |
| Minimum | 0.28% | 0.92% |
| Maximum | 5.4% | 25.3% |
| Range | 5.1% | 24.4% |
| Mean | 2.5% | 3.2% |
| Median | 2.3% | 2.7% |
| Interquartile 25% (IQ1) | 1.9% | 2.3% |
| Interquartile 75% (IQ3) | 3.0% | 3.5% |
| Interquartile Range (IQR) | 1.1% | 1.1% |
| Standard Deviation (Sample) | 1.1% | 2.6% |
| Standard Deviation (Population) | 1.0% | 2.6% |
Similar Demographics by Single Father Households
Demographics Similar to Guyanese by Single Father Households
In terms of single father households, the demographic groups most similar to Guyanese are South African (2.1%, a difference of 0.040%), Immigrants from Moldova (2.1%, a difference of 0.13%), Immigrants from Northern Africa (2.1%, a difference of 0.19%), Arab (2.1%, a difference of 0.25%), and Immigrants from Western Europe (2.1%, a difference of 0.34%).
| Demographics | Rating | Rank | Single Father Households |
| Immigrants | Guyana | 99.4 /100 | #91 | Exceptional 2.1% |
| Romanians | 99.4 /100 | #92 | Exceptional 2.1% |
| Croatians | 99.3 /100 | #93 | Exceptional 2.1% |
| Ukrainians | 99.3 /100 | #94 | Exceptional 2.1% |
| Bermudans | 99.2 /100 | #95 | Exceptional 2.1% |
| Arabs | 99.2 /100 | #96 | Exceptional 2.1% |
| Immigrants | Moldova | 99.1 /100 | #97 | Exceptional 2.1% |
| Guyanese | 99.1 /100 | #98 | Exceptional 2.1% |
| South Africans | 99.1 /100 | #99 | Exceptional 2.1% |
| Immigrants | Northern Africa | 99.0 /100 | #100 | Exceptional 2.1% |
| Immigrants | Western Europe | 98.9 /100 | #101 | Exceptional 2.1% |
| Argentineans | 98.9 /100 | #102 | Exceptional 2.1% |
| Lebanese | 98.9 /100 | #103 | Exceptional 2.1% |
| Alsatians | 98.9 /100 | #104 | Exceptional 2.1% |
| Palestinians | 98.6 /100 | #105 | Exceptional 2.2% |
Demographics Similar to Puerto Ricans by Single Father Households
In terms of single father households, the demographic groups most similar to Puerto Ricans are Iroquois (2.6%, a difference of 0.030%), Creek (2.6%, a difference of 0.070%), Belizean (2.6%, a difference of 0.070%), Immigrants from Dominican Republic (2.6%, a difference of 0.42%), and Seminole (2.6%, a difference of 0.44%).
| Demographics | Rating | Rank | Single Father Households |
| Guamanians/Chamorros | 0.4 /100 | #267 | Tragic 2.6% |
| Haitians | 0.4 /100 | #268 | Tragic 2.6% |
| Cubans | 0.3 /100 | #269 | Tragic 2.6% |
| Seminole | 0.3 /100 | #270 | Tragic 2.6% |
| Creek | 0.2 /100 | #271 | Tragic 2.6% |
| Belizeans | 0.2 /100 | #272 | Tragic 2.6% |
| Iroquois | 0.2 /100 | #273 | Tragic 2.6% |
| Puerto Ricans | 0.2 /100 | #274 | Tragic 2.6% |
| Immigrants | Dominican Republic | 0.2 /100 | #275 | Tragic 2.6% |
| Immigrants | Haiti | 0.1 /100 | #276 | Tragic 2.6% |
| Shoshone | 0.1 /100 | #277 | Tragic 2.6% |
| Cherokee | 0.1 /100 | #278 | Tragic 2.6% |
| Samoans | 0.1 /100 | #279 | Tragic 2.6% |
| Immigrants | Portugal | 0.1 /100 | #280 | Tragic 2.6% |
| Nicaraguans | 0.1 /100 | #281 | Tragic 2.6% |