Moroccan vs Immigrants from Greece Currently Married
COMPARE
Moroccan
Immigrants from Greece
Currently Married
Currently Married Comparison
Moroccans
Immigrants from Greece
44.6%
CURRENTLY MARRIED
0.9/ 100
METRIC RATING
238th/ 347
METRIC RANK
47.7%
CURRENTLY MARRIED
93.1/ 100
METRIC RATING
106th/ 347
METRIC RANK
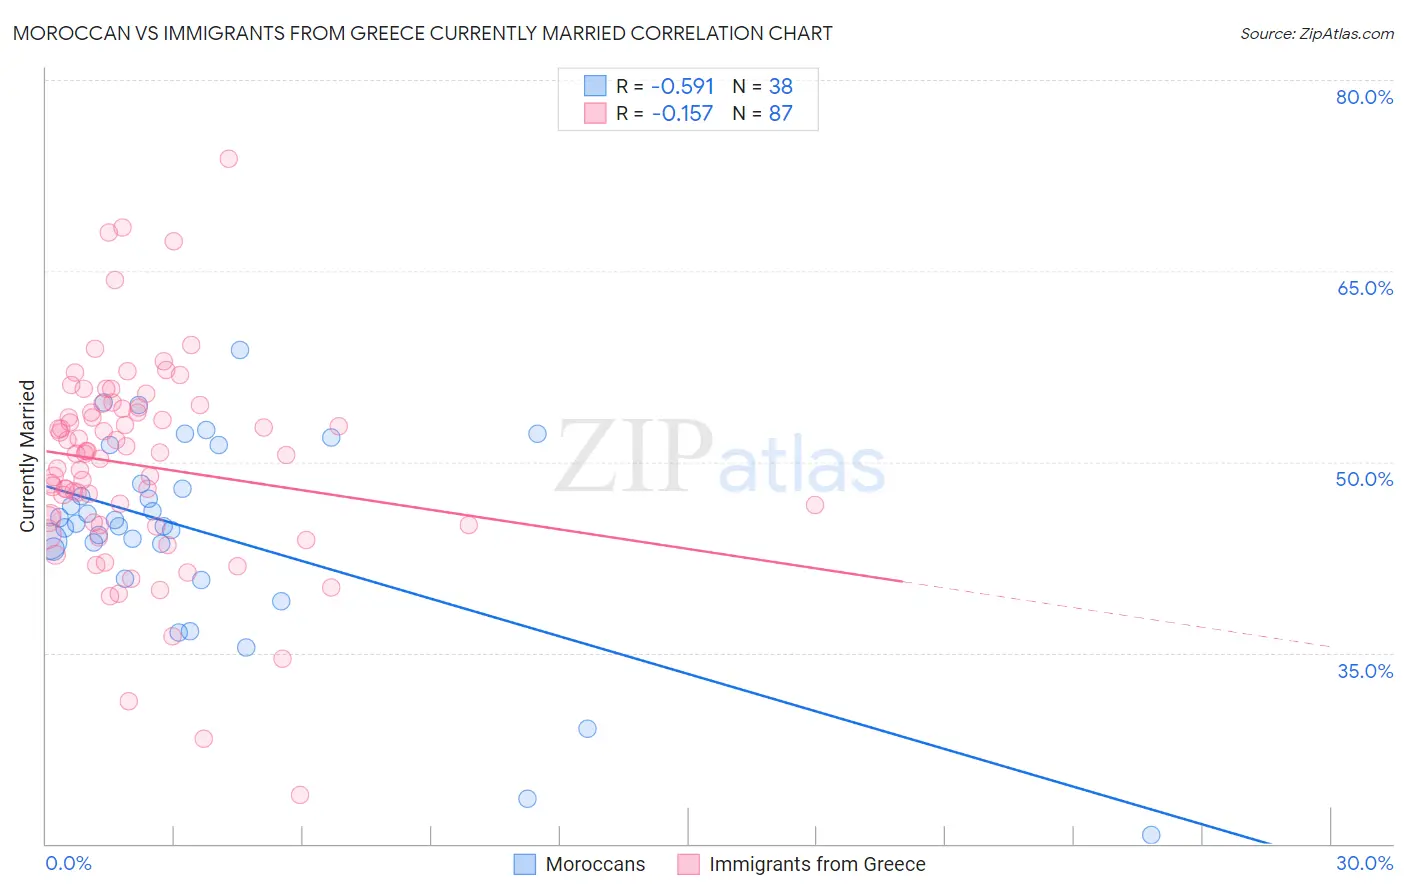
Moroccan vs Immigrants from Greece Currently Married Correlation Chart
The statistical analysis conducted on geographies consisting of 201,812,139 people shows a substantial negative correlation between the proportion of Moroccans and percentage of population currently married in the United States with a correlation coefficient (R) of -0.591 and weighted average of 44.6%. Similarly, the statistical analysis conducted on geographies consisting of 216,874,138 people shows a poor negative correlation between the proportion of Immigrants from Greece and percentage of population currently married in the United States with a correlation coefficient (R) of -0.157 and weighted average of 47.7%, a difference of 7.0%.
Currently Married Correlation Summary
| Measurement | Moroccan | Immigrants from Greece |
| Minimum | 20.7% | 23.8% |
| Maximum | 58.8% | 73.8% |
| Range | 38.1% | 50.0% |
| Mean | 44.4% | 49.7% |
| Median | 45.0% | 50.6% |
| Interquartile 25% (IQ1) | 43.1% | 45.0% |
| Interquartile 75% (IQ3) | 48.3% | 54.2% |
| Interquartile Range (IQR) | 5.2% | 9.1% |
| Standard Deviation (Sample) | 7.9% | 8.1% |
| Standard Deviation (Population) | 7.8% | 8.1% |
Similar Demographics by Currently Married
Demographics Similar to Moroccans by Currently Married
In terms of currently married, the demographic groups most similar to Moroccans are Cuban (44.6%, a difference of 0.080%), Seminole (44.6%, a difference of 0.080%), Alaskan Athabascan (44.6%, a difference of 0.090%), Immigrants from Mexico (44.5%, a difference of 0.14%), and Mexican American Indian (44.5%, a difference of 0.14%).
| Demographics | Rating | Rank | Currently Married |
| Immigrants | Panama | 1.5 /100 | #231 | Tragic 44.9% |
| Nepalese | 1.2 /100 | #232 | Tragic 44.7% |
| Immigrants | Saudi Arabia | 1.1 /100 | #233 | Tragic 44.7% |
| Iroquois | 1.1 /100 | #234 | Tragic 44.7% |
| Alaskan Athabascans | 0.9 /100 | #235 | Tragic 44.6% |
| Cubans | 0.9 /100 | #236 | Tragic 44.6% |
| Seminole | 0.9 /100 | #237 | Tragic 44.6% |
| Moroccans | 0.9 /100 | #238 | Tragic 44.6% |
| Immigrants | Mexico | 0.7 /100 | #239 | Tragic 44.5% |
| Mexican American Indians | 0.7 /100 | #240 | Tragic 44.5% |
| Ethiopians | 0.7 /100 | #241 | Tragic 44.5% |
| Immigrants | Cambodia | 0.7 /100 | #242 | Tragic 44.5% |
| Immigrants | Ethiopia | 0.7 /100 | #243 | Tragic 44.5% |
| Japanese | 0.6 /100 | #244 | Tragic 44.5% |
| Immigrants | Armenia | 0.4 /100 | #245 | Tragic 44.3% |
Demographics Similar to Immigrants from Greece by Currently Married
In terms of currently married, the demographic groups most similar to Immigrants from Greece are Immigrants from Singapore (47.8%, a difference of 0.030%), Immigrants from Italy (47.7%, a difference of 0.030%), Serbian (47.8%, a difference of 0.080%), Cypriot (47.8%, a difference of 0.090%), and Tsimshian (47.7%, a difference of 0.090%).
| Demographics | Rating | Rank | Currently Married |
| Immigrants | Sweden | 94.3 /100 | #99 | Exceptional 47.8% |
| Celtics | 94.2 /100 | #100 | Exceptional 47.8% |
| Immigrants | Germany | 94.1 /100 | #101 | Exceptional 47.8% |
| Turks | 93.9 /100 | #102 | Exceptional 47.8% |
| Cypriots | 93.7 /100 | #103 | Exceptional 47.8% |
| Serbians | 93.6 /100 | #104 | Exceptional 47.8% |
| Immigrants | Singapore | 93.3 /100 | #105 | Exceptional 47.8% |
| Immigrants | Greece | 93.1 /100 | #106 | Exceptional 47.7% |
| Immigrants | Italy | 92.9 /100 | #107 | Exceptional 47.7% |
| Tsimshian | 92.4 /100 | #108 | Exceptional 47.7% |
| Immigrants | Egypt | 92.3 /100 | #109 | Exceptional 47.7% |
| Immigrants | Russia | 92.0 /100 | #110 | Exceptional 47.7% |
| Immigrants | Hungary | 91.2 /100 | #111 | Exceptional 47.6% |
| Immigrants | Western Europe | 91.1 /100 | #112 | Exceptional 47.6% |
| Immigrants | Denmark | 90.9 /100 | #113 | Exceptional 47.6% |