Moroccan vs Celtic Single Mother Households
COMPARE
Moroccan
Celtic
Single Mother Households
Single Mother Households Comparison
Moroccans
Celtics
6.6%
SINGLE MOTHER HOUSEHOLDS
17.4/ 100
METRIC RATING
197th/ 347
METRIC RANK
6.1%
SINGLE MOTHER HOUSEHOLDS
73.3/ 100
METRIC RATING
158th/ 347
METRIC RANK
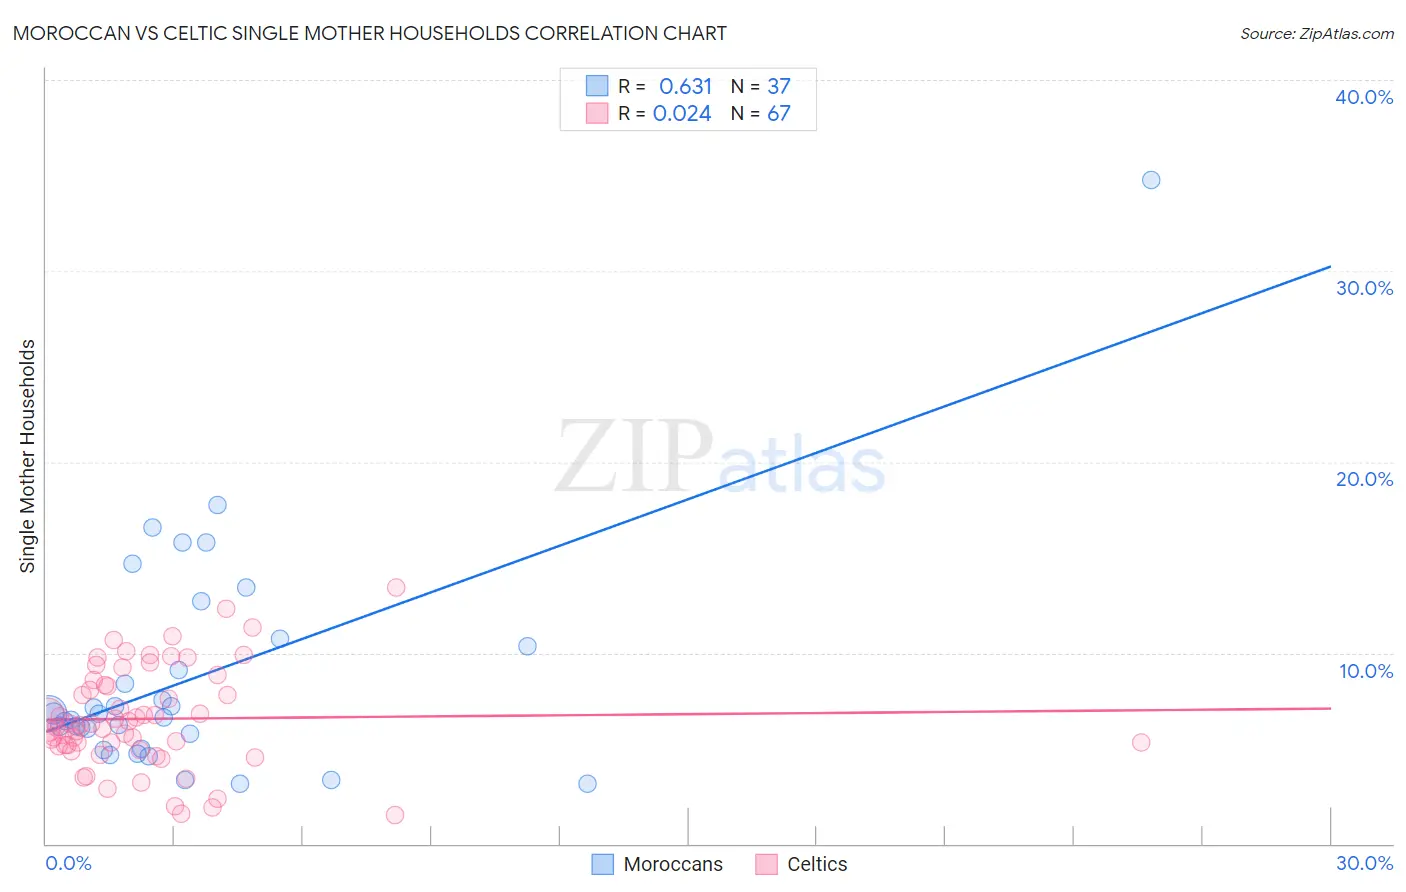
Moroccan vs Celtic Single Mother Households Correlation Chart
The statistical analysis conducted on geographies consisting of 201,586,656 people shows a significant positive correlation between the proportion of Moroccans and percentage of single mother households in the United States with a correlation coefficient (R) of 0.631 and weighted average of 6.6%. Similarly, the statistical analysis conducted on geographies consisting of 168,688,619 people shows no correlation between the proportion of Celtics and percentage of single mother households in the United States with a correlation coefficient (R) of 0.024 and weighted average of 6.1%, a difference of 7.2%.
Single Mother Households Correlation Summary
| Measurement | Moroccan | Celtic |
| Minimum | 3.1% | 1.5% |
| Maximum | 34.7% | 13.4% |
| Range | 31.6% | 11.9% |
| Mean | 8.7% | 6.5% |
| Median | 6.8% | 6.2% |
| Interquartile 25% (IQ1) | 5.4% | 5.1% |
| Interquartile 75% (IQ3) | 10.6% | 8.3% |
| Interquartile Range (IQR) | 5.2% | 3.2% |
| Standard Deviation (Sample) | 5.9% | 2.6% |
| Standard Deviation (Population) | 5.9% | 2.6% |
Similar Demographics by Single Mother Households
Demographics Similar to Moroccans by Single Mother Households
In terms of single mother households, the demographic groups most similar to Moroccans are South American (6.6%, a difference of 0.11%), Uruguayan (6.6%, a difference of 0.11%), Immigrants from Uganda (6.6%, a difference of 0.15%), Colombian (6.6%, a difference of 0.16%), and Hawaiian (6.6%, a difference of 0.25%).
| Demographics | Rating | Rank | Single Mother Households |
| Peruvians | 21.6 /100 | #190 | Fair 6.5% |
| Samoans | 21.2 /100 | #191 | Fair 6.5% |
| Americans | 19.0 /100 | #192 | Poor 6.6% |
| Colombians | 18.3 /100 | #193 | Poor 6.6% |
| Immigrants | Uganda | 18.3 /100 | #194 | Poor 6.6% |
| South Americans | 18.0 /100 | #195 | Poor 6.6% |
| Uruguayans | 18.0 /100 | #196 | Poor 6.6% |
| Moroccans | 17.4 /100 | #197 | Poor 6.6% |
| Hawaiians | 16.1 /100 | #198 | Poor 6.6% |
| Potawatomi | 15.5 /100 | #199 | Poor 6.6% |
| Immigrants | Ethiopia | 14.7 /100 | #200 | Poor 6.6% |
| Venezuelans | 12.9 /100 | #201 | Poor 6.6% |
| Guamanians/Chamorros | 12.4 /100 | #202 | Poor 6.6% |
| Immigrants | Peru | 12.0 /100 | #203 | Poor 6.7% |
| Immigrants | Fiji | 11.9 /100 | #204 | Poor 6.7% |
Demographics Similar to Celtics by Single Mother Households
In terms of single mother households, the demographic groups most similar to Celtics are Yugoslavian (6.1%, a difference of 0.040%), Iraqi (6.1%, a difference of 0.050%), Chilean (6.1%, a difference of 0.13%), Immigrants from Germany (6.1%, a difference of 0.13%), and Native Hawaiian (6.1%, a difference of 0.24%).
| Demographics | Rating | Rank | Single Mother Households |
| Immigrants | Southern Europe | 80.5 /100 | #151 | Excellent 6.1% |
| Pakistanis | 79.2 /100 | #152 | Good 6.1% |
| Immigrants | Brazil | 78.9 /100 | #153 | Good 6.1% |
| Immigrants | Philippines | 78.5 /100 | #154 | Good 6.1% |
| Whites/Caucasians | 76.5 /100 | #155 | Good 6.1% |
| Native Hawaiians | 75.0 /100 | #156 | Good 6.1% |
| Chileans | 74.2 /100 | #157 | Good 6.1% |
| Celtics | 73.3 /100 | #158 | Good 6.1% |
| Yugoslavians | 73.1 /100 | #159 | Good 6.1% |
| Iraqis | 73.0 /100 | #160 | Good 6.1% |
| Immigrants | Germany | 72.4 /100 | #161 | Good 6.1% |
| Immigrants | Zimbabwe | 69.9 /100 | #162 | Good 6.2% |
| Alsatians | 68.7 /100 | #163 | Good 6.2% |
| Immigrants | Northern Africa | 68.0 /100 | #164 | Good 6.2% |
| Immigrants | Syria | 67.4 /100 | #165 | Good 6.2% |