French American Indian vs Pueblo Divorced or Separated
COMPARE
French American Indian
Pueblo
Divorced or Separated
Divorced or Separated Comparison
French American Indians
Pueblo
13.2%
DIVORCED OR SEPARATED
0.0/ 100
METRIC RATING
307th/ 347
METRIC RANK
12.7%
DIVORCED OR SEPARATED
0.2/ 100
METRIC RATING
281st/ 347
METRIC RANK
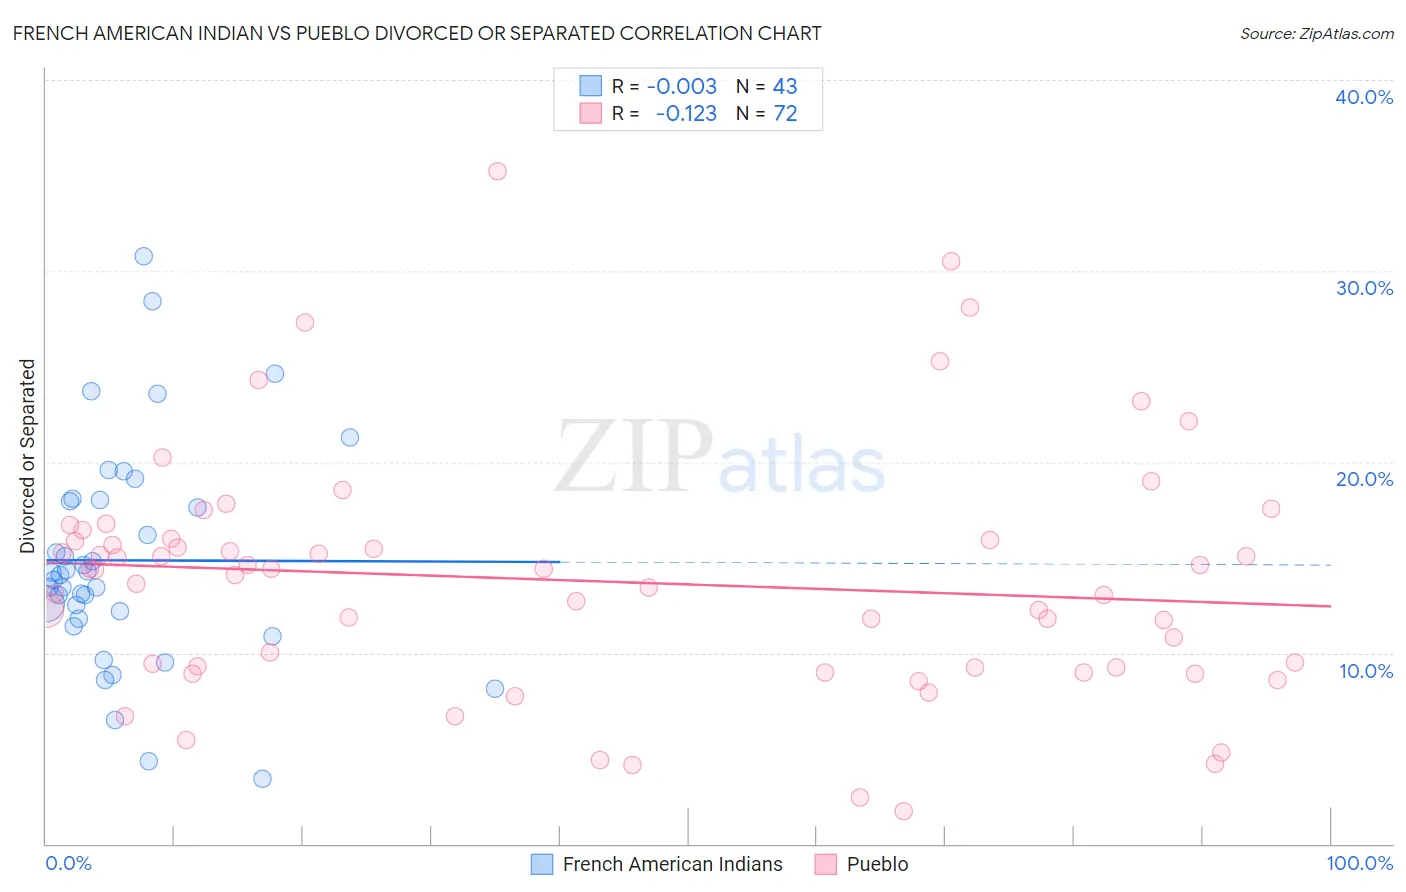
French American Indian vs Pueblo Divorced or Separated Correlation Chart
The statistical analysis conducted on geographies consisting of 131,970,450 people shows no correlation between the proportion of French American Indians and percentage of population currently divorced or separated in the United States with a correlation coefficient (R) of -0.003 and weighted average of 13.2%. Similarly, the statistical analysis conducted on geographies consisting of 120,078,474 people shows a poor negative correlation between the proportion of Pueblo and percentage of population currently divorced or separated in the United States with a correlation coefficient (R) of -0.123 and weighted average of 12.7%, a difference of 3.9%.
Divorced or Separated Correlation Summary
| Measurement | French American Indian | Pueblo |
| Minimum | 3.4% | 1.7% |
| Maximum | 30.8% | 35.2% |
| Range | 27.4% | 33.5% |
| Mean | 14.8% | 13.8% |
| Median | 14.1% | 14.2% |
| Interquartile 25% (IQ1) | 11.8% | 9.2% |
| Interquartile 75% (IQ3) | 18.0% | 16.0% |
| Interquartile Range (IQR) | 6.2% | 6.7% |
| Standard Deviation (Sample) | 5.8% | 6.4% |
| Standard Deviation (Population) | 5.7% | 6.3% |
Similar Demographics by Divorced or Separated
Demographics Similar to French American Indians by Divorced or Separated
In terms of divorced or separated, the demographic groups most similar to French American Indians are Ottawa (13.2%, a difference of 0.090%), American (13.2%, a difference of 0.10%), African (13.2%, a difference of 0.12%), Sioux (13.2%, a difference of 0.14%), and Tlingit-Haida (13.2%, a difference of 0.25%).
| Demographics | Rating | Rank | Divorced or Separated |
| Immigrants | Cabo Verde | 0.0 /100 | #300 | Tragic 13.1% |
| Alaskan Athabascans | 0.0 /100 | #301 | Tragic 13.1% |
| Immigrants | Venezuela | 0.0 /100 | #302 | Tragic 13.1% |
| Cape Verdeans | 0.0 /100 | #303 | Tragic 13.1% |
| Hopi | 0.0 /100 | #304 | Tragic 13.2% |
| Chippewa | 0.0 /100 | #305 | Tragic 13.2% |
| Tlingit-Haida | 0.0 /100 | #306 | Tragic 13.2% |
| French American Indians | 0.0 /100 | #307 | Tragic 13.2% |
| Ottawa | 0.0 /100 | #308 | Tragic 13.2% |
| Americans | 0.0 /100 | #309 | Tragic 13.2% |
| Africans | 0.0 /100 | #310 | Tragic 13.2% |
| Sioux | 0.0 /100 | #311 | Tragic 13.2% |
| Blackfeet | 0.0 /100 | #312 | Tragic 13.3% |
| Immigrants | Nicaragua | 0.0 /100 | #313 | Tragic 13.3% |
| Yaqui | 0.0 /100 | #314 | Tragic 13.3% |
Demographics Similar to Pueblo by Divorced or Separated
In terms of divorced or separated, the demographic groups most similar to Pueblo are Immigrants from Zaire (12.7%, a difference of 0.040%), Lumbee (12.7%, a difference of 0.11%), Immigrants from Dominican Republic (12.7%, a difference of 0.11%), Subsaharan African (12.7%, a difference of 0.12%), and Delaware (12.7%, a difference of 0.13%).
| Demographics | Rating | Rank | Divorced or Separated |
| Bermudans | 0.3 /100 | #274 | Tragic 12.7% |
| Central American Indians | 0.3 /100 | #275 | Tragic 12.7% |
| Spaniards | 0.2 /100 | #276 | Tragic 12.7% |
| Dominicans | 0.2 /100 | #277 | Tragic 12.7% |
| Lumbee | 0.2 /100 | #278 | Tragic 12.7% |
| Immigrants | Dominican Republic | 0.2 /100 | #279 | Tragic 12.7% |
| Immigrants | Zaire | 0.2 /100 | #280 | Tragic 12.7% |
| Pueblo | 0.2 /100 | #281 | Tragic 12.7% |
| Sub-Saharan Africans | 0.1 /100 | #282 | Tragic 12.7% |
| Delaware | 0.1 /100 | #283 | Tragic 12.7% |
| Immigrants | Nonimmigrants | 0.1 /100 | #284 | Tragic 12.8% |
| French | 0.1 /100 | #285 | Tragic 12.8% |
| Spanish | 0.1 /100 | #286 | Tragic 12.8% |
| Hondurans | 0.1 /100 | #287 | Tragic 12.8% |
| French Canadians | 0.1 /100 | #288 | Tragic 12.8% |