Mongolian vs Moroccan Single Father Households
COMPARE
Mongolian
Moroccan
Single Father Households
Single Father Households Comparison
Mongolians
Moroccans
2.1%
SINGLE FATHER HOUSEHOLDS
99.9/ 100
METRIC RATING
64th/ 347
METRIC RANK
2.2%
SINGLE FATHER HOUSEHOLDS
96.9/ 100
METRIC RATING
126th/ 347
METRIC RANK
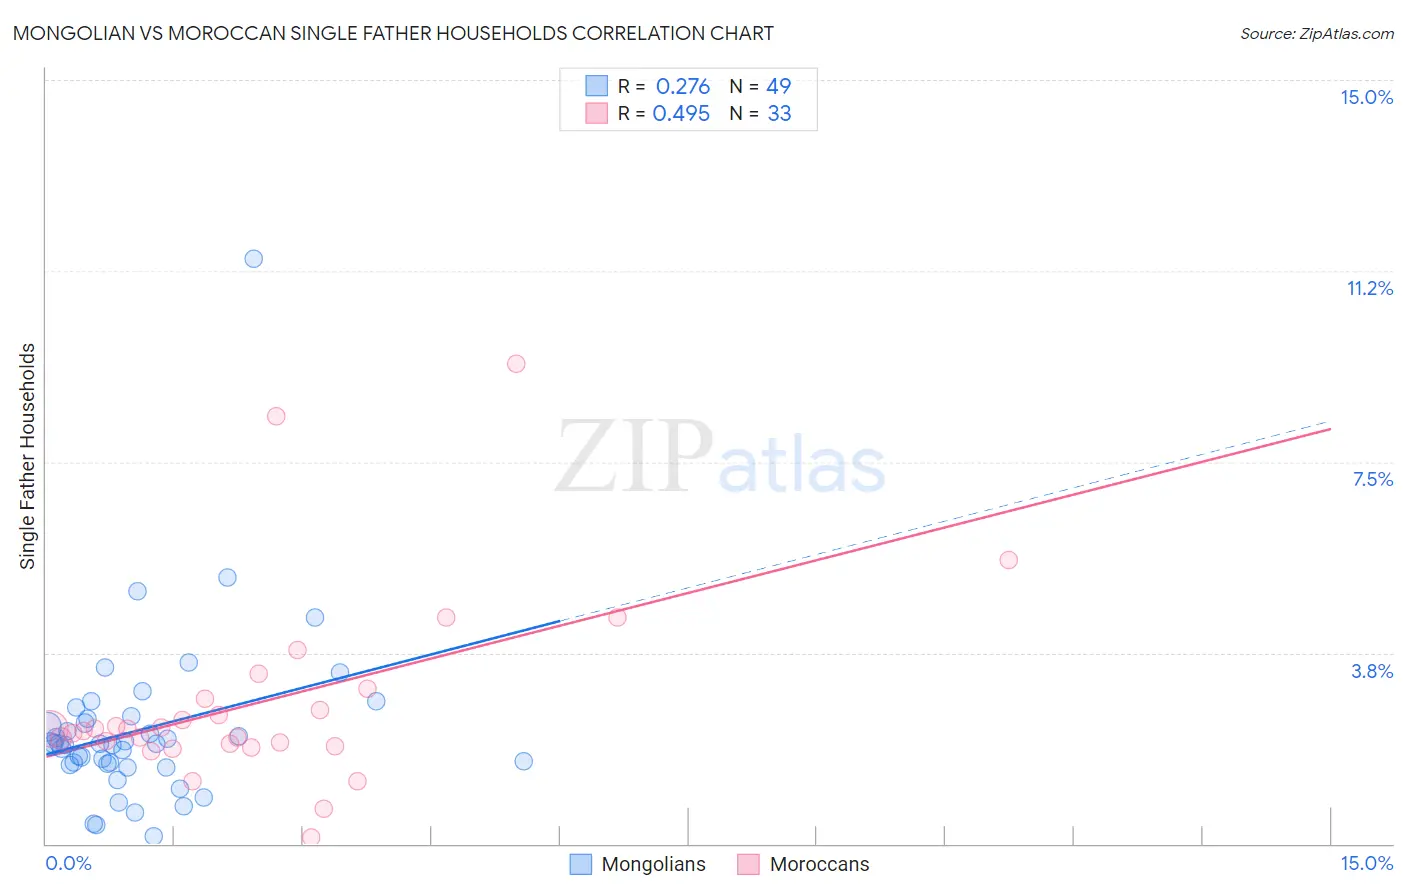
Mongolian vs Moroccan Single Father Households Correlation Chart
The statistical analysis conducted on geographies consisting of 139,899,645 people shows a weak positive correlation between the proportion of Mongolians and percentage of single father households in the United States with a correlation coefficient (R) of 0.276 and weighted average of 2.1%. Similarly, the statistical analysis conducted on geographies consisting of 201,125,863 people shows a moderate positive correlation between the proportion of Moroccans and percentage of single father households in the United States with a correlation coefficient (R) of 0.495 and weighted average of 2.2%, a difference of 6.7%.
Single Father Households Correlation Summary
| Measurement | Mongolian | Moroccan |
| Minimum | 0.15% | 0.13% |
| Maximum | 11.5% | 9.4% |
| Range | 11.3% | 9.3% |
| Mean | 2.2% | 2.8% |
| Median | 2.0% | 2.3% |
| Interquartile 25% (IQ1) | 1.6% | 1.9% |
| Interquartile 75% (IQ3) | 2.5% | 2.9% |
| Interquartile Range (IQR) | 0.91% | 1.0% |
| Standard Deviation (Sample) | 1.7% | 1.9% |
| Standard Deviation (Population) | 1.7% | 1.9% |
Similar Demographics by Single Father Households
Demographics Similar to Mongolians by Single Father Households
In terms of single father households, the demographic groups most similar to Mongolians are Paraguayan (2.1%, a difference of 0.030%), Maltese (2.0%, a difference of 0.14%), Immigrants from Malaysia (2.0%, a difference of 0.34%), Immigrants from Western Asia (2.1%, a difference of 0.39%), and Immigrants from Italy (2.1%, a difference of 0.43%).
| Demographics | Rating | Rank | Single Father Households |
| Burmese | 99.9 /100 | #57 | Exceptional 2.0% |
| Immigrants | Czechoslovakia | 99.9 /100 | #58 | Exceptional 2.0% |
| Immigrants | North Macedonia | 99.9 /100 | #59 | Exceptional 2.0% |
| Immigrants | Austria | 99.9 /100 | #60 | Exceptional 2.0% |
| Vietnamese | 99.9 /100 | #61 | Exceptional 2.0% |
| Immigrants | Malaysia | 99.9 /100 | #62 | Exceptional 2.0% |
| Maltese | 99.9 /100 | #63 | Exceptional 2.0% |
| Mongolians | 99.9 /100 | #64 | Exceptional 2.1% |
| Paraguayans | 99.9 /100 | #65 | Exceptional 2.1% |
| Immigrants | Western Asia | 99.8 /100 | #66 | Exceptional 2.1% |
| Immigrants | Italy | 99.8 /100 | #67 | Exceptional 2.1% |
| Immigrants | Denmark | 99.8 /100 | #68 | Exceptional 2.1% |
| Immigrants | Romania | 99.8 /100 | #69 | Exceptional 2.1% |
| Egyptians | 99.8 /100 | #70 | Exceptional 2.1% |
| Immigrants | Kuwait | 99.8 /100 | #71 | Exceptional 2.1% |
Demographics Similar to Moroccans by Single Father Households
In terms of single father households, the demographic groups most similar to Moroccans are Jordanian (2.2%, a difference of 0.0%), Immigrants from England (2.2%, a difference of 0.050%), Serbian (2.2%, a difference of 0.060%), Immigrants from Chile (2.2%, a difference of 0.17%), and Immigrants from Jordan (2.2%, a difference of 0.23%).
| Demographics | Rating | Rank | Single Father Households |
| Trinidadians and Tobagonians | 97.8 /100 | #119 | Exceptional 2.2% |
| Australians | 97.7 /100 | #120 | Exceptional 2.2% |
| Immigrants | Brazil | 97.7 /100 | #121 | Exceptional 2.2% |
| Immigrants | Iraq | 97.6 /100 | #122 | Exceptional 2.2% |
| Immigrants | Yemen | 97.5 /100 | #123 | Exceptional 2.2% |
| British West Indians | 97.4 /100 | #124 | Exceptional 2.2% |
| Immigrants | Indonesia | 97.4 /100 | #125 | Exceptional 2.2% |
| Moroccans | 96.9 /100 | #126 | Exceptional 2.2% |
| Jordanians | 96.9 /100 | #127 | Exceptional 2.2% |
| Immigrants | England | 96.8 /100 | #128 | Exceptional 2.2% |
| Serbians | 96.8 /100 | #129 | Exceptional 2.2% |
| Immigrants | Chile | 96.7 /100 | #130 | Exceptional 2.2% |
| Immigrants | Jordan | 96.6 /100 | #131 | Exceptional 2.2% |
| Poles | 96.5 /100 | #132 | Exceptional 2.2% |
| Taiwanese | 96.3 /100 | #133 | Exceptional 2.2% |