Mongolian vs Immigrants from Northern Africa Single Father Households
COMPARE
Mongolian
Immigrants from Northern Africa
Single Father Households
Single Father Households Comparison
Mongolians
Immigrants from Northern Africa
2.1%
SINGLE FATHER HOUSEHOLDS
99.9/ 100
METRIC RATING
64th/ 347
METRIC RANK
2.1%
SINGLE FATHER HOUSEHOLDS
99.0/ 100
METRIC RATING
100th/ 347
METRIC RANK
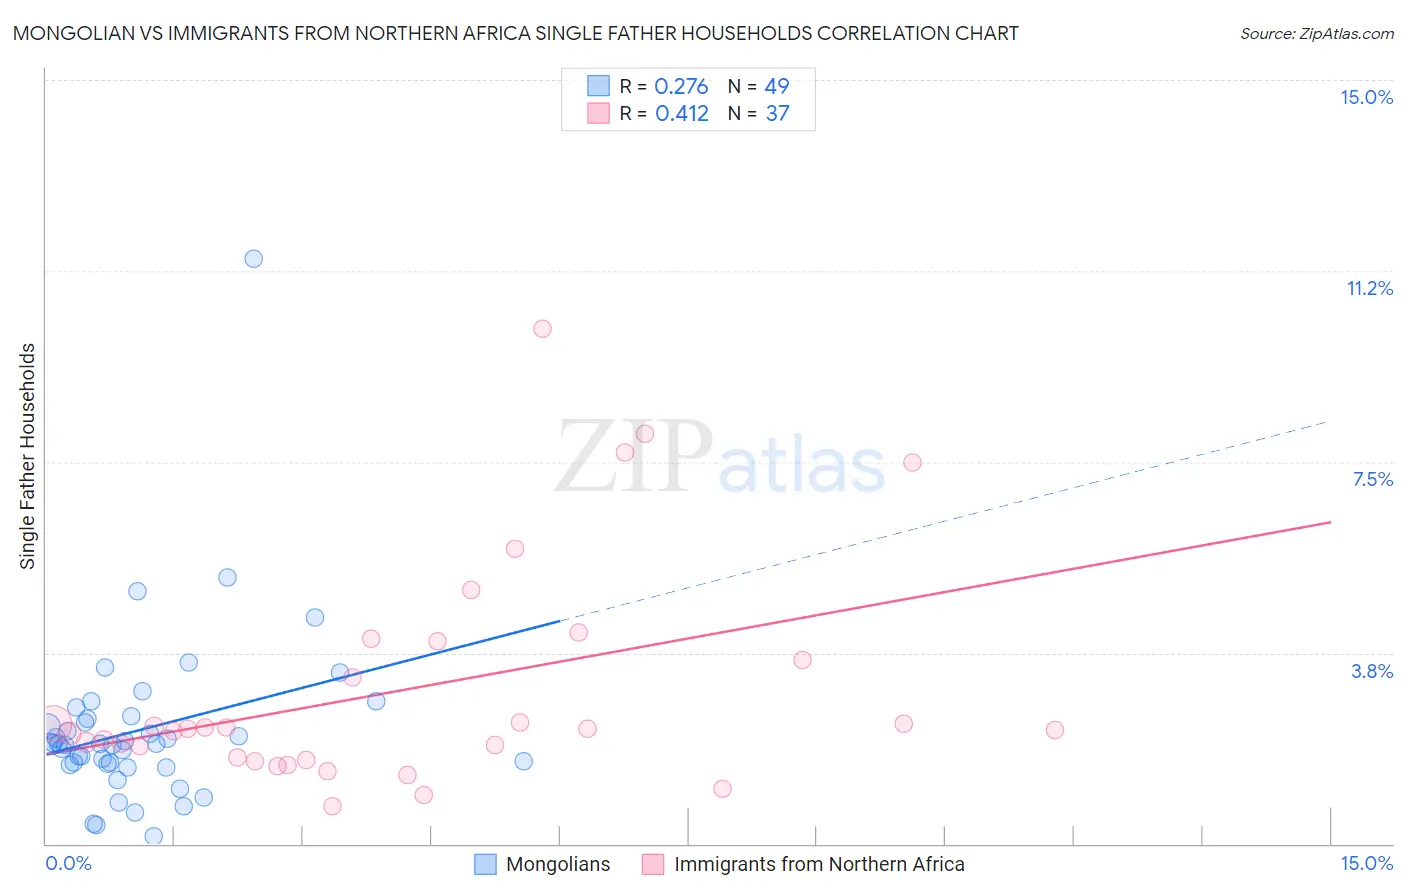
Mongolian vs Immigrants from Northern Africa Single Father Households Correlation Chart
The statistical analysis conducted on geographies consisting of 139,899,645 people shows a weak positive correlation between the proportion of Mongolians and percentage of single father households in the United States with a correlation coefficient (R) of 0.276 and weighted average of 2.1%. Similarly, the statistical analysis conducted on geographies consisting of 319,229,485 people shows a moderate positive correlation between the proportion of Immigrants from Northern Africa and percentage of single father households in the United States with a correlation coefficient (R) of 0.412 and weighted average of 2.1%, a difference of 4.4%.
Single Father Households Correlation Summary
| Measurement | Mongolian | Immigrants from Northern Africa |
| Minimum | 0.15% | 0.74% |
| Maximum | 11.5% | 10.1% |
| Range | 11.3% | 9.4% |
| Mean | 2.2% | 3.0% |
| Median | 2.0% | 2.3% |
| Interquartile 25% (IQ1) | 1.6% | 1.7% |
| Interquartile 75% (IQ3) | 2.5% | 3.8% |
| Interquartile Range (IQR) | 0.91% | 2.1% |
| Standard Deviation (Sample) | 1.7% | 2.2% |
| Standard Deviation (Population) | 1.7% | 2.2% |
Similar Demographics by Single Father Households
Demographics Similar to Mongolians by Single Father Households
In terms of single father households, the demographic groups most similar to Mongolians are Paraguayan (2.1%, a difference of 0.030%), Maltese (2.0%, a difference of 0.14%), Immigrants from Malaysia (2.0%, a difference of 0.34%), Immigrants from Western Asia (2.1%, a difference of 0.39%), and Immigrants from Italy (2.1%, a difference of 0.43%).
| Demographics | Rating | Rank | Single Father Households |
| Burmese | 99.9 /100 | #57 | Exceptional 2.0% |
| Immigrants | Czechoslovakia | 99.9 /100 | #58 | Exceptional 2.0% |
| Immigrants | North Macedonia | 99.9 /100 | #59 | Exceptional 2.0% |
| Immigrants | Austria | 99.9 /100 | #60 | Exceptional 2.0% |
| Vietnamese | 99.9 /100 | #61 | Exceptional 2.0% |
| Immigrants | Malaysia | 99.9 /100 | #62 | Exceptional 2.0% |
| Maltese | 99.9 /100 | #63 | Exceptional 2.0% |
| Mongolians | 99.9 /100 | #64 | Exceptional 2.1% |
| Paraguayans | 99.9 /100 | #65 | Exceptional 2.1% |
| Immigrants | Western Asia | 99.8 /100 | #66 | Exceptional 2.1% |
| Immigrants | Italy | 99.8 /100 | #67 | Exceptional 2.1% |
| Immigrants | Denmark | 99.8 /100 | #68 | Exceptional 2.1% |
| Immigrants | Romania | 99.8 /100 | #69 | Exceptional 2.1% |
| Egyptians | 99.8 /100 | #70 | Exceptional 2.1% |
| Immigrants | Kuwait | 99.8 /100 | #71 | Exceptional 2.1% |
Demographics Similar to Immigrants from Northern Africa by Single Father Households
In terms of single father households, the demographic groups most similar to Immigrants from Northern Africa are South African (2.1%, a difference of 0.15%), Immigrants from Western Europe (2.1%, a difference of 0.15%), Argentinean (2.1%, a difference of 0.18%), Guyanese (2.1%, a difference of 0.19%), and Lebanese (2.1%, a difference of 0.20%).
| Demographics | Rating | Rank | Single Father Households |
| Croatians | 99.3 /100 | #93 | Exceptional 2.1% |
| Ukrainians | 99.3 /100 | #94 | Exceptional 2.1% |
| Bermudans | 99.2 /100 | #95 | Exceptional 2.1% |
| Arabs | 99.2 /100 | #96 | Exceptional 2.1% |
| Immigrants | Moldova | 99.1 /100 | #97 | Exceptional 2.1% |
| Guyanese | 99.1 /100 | #98 | Exceptional 2.1% |
| South Africans | 99.1 /100 | #99 | Exceptional 2.1% |
| Immigrants | Northern Africa | 99.0 /100 | #100 | Exceptional 2.1% |
| Immigrants | Western Europe | 98.9 /100 | #101 | Exceptional 2.1% |
| Argentineans | 98.9 /100 | #102 | Exceptional 2.1% |
| Lebanese | 98.9 /100 | #103 | Exceptional 2.1% |
| Alsatians | 98.9 /100 | #104 | Exceptional 2.1% |
| Palestinians | 98.6 /100 | #105 | Exceptional 2.2% |
| Immigrants | Southern Europe | 98.6 /100 | #106 | Exceptional 2.2% |
| Slovenes | 98.5 /100 | #107 | Exceptional 2.2% |