Spanish American Indian vs Moroccan Single Father Households
COMPARE
Spanish American Indian
Moroccan
Single Father Households
Single Father Households Comparison
Spanish American Indians
Moroccans
2.9%
SINGLE FATHER HOUSEHOLDS
0.0/ 100
METRIC RATING
311th/ 347
METRIC RANK
2.2%
SINGLE FATHER HOUSEHOLDS
96.9/ 100
METRIC RATING
126th/ 347
METRIC RANK
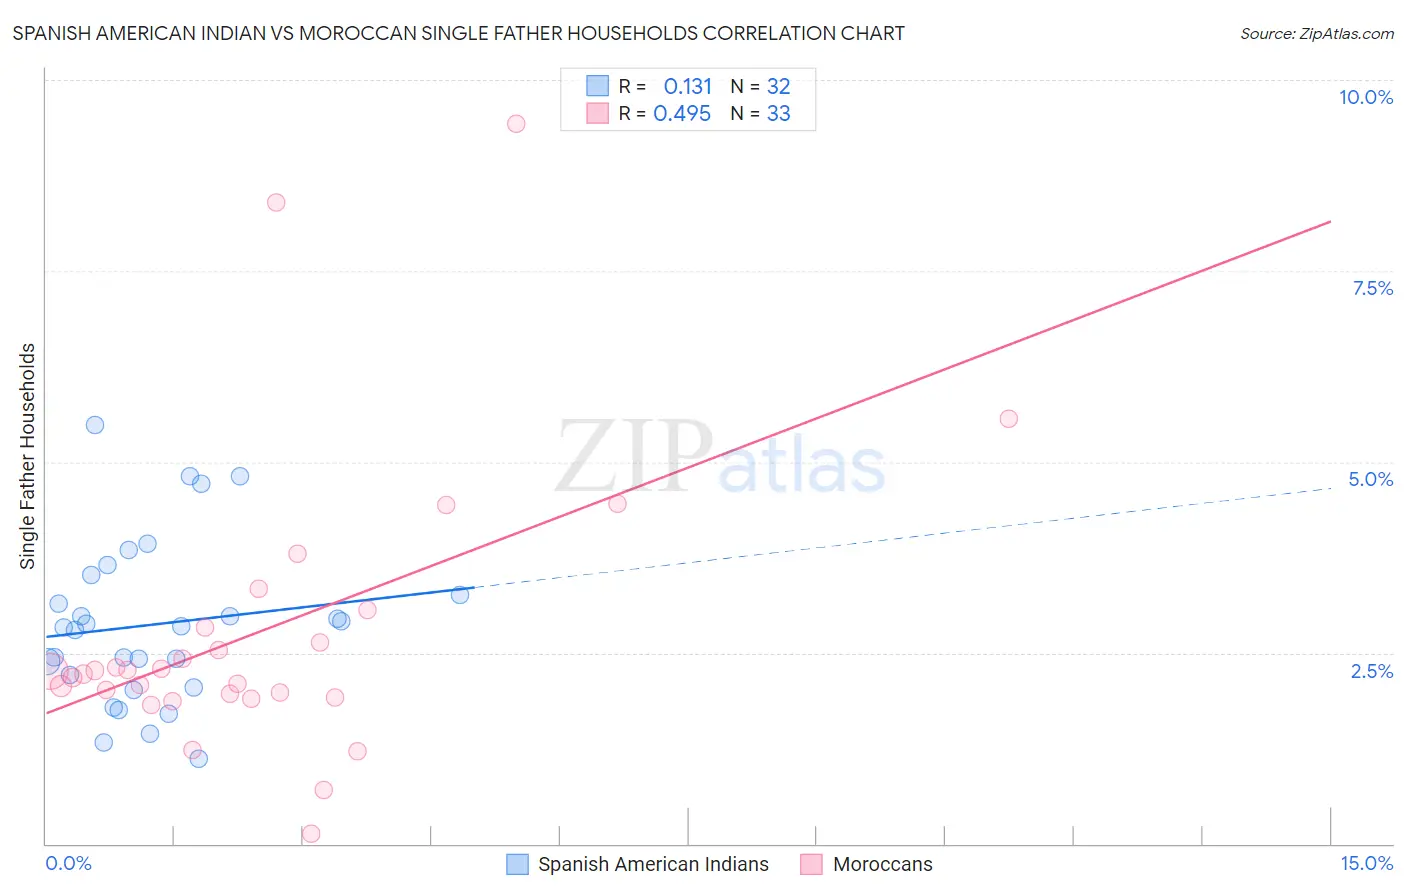
Spanish American Indian vs Moroccan Single Father Households Correlation Chart
The statistical analysis conducted on geographies consisting of 73,114,798 people shows a poor positive correlation between the proportion of Spanish American Indians and percentage of single father households in the United States with a correlation coefficient (R) of 0.131 and weighted average of 2.9%. Similarly, the statistical analysis conducted on geographies consisting of 201,125,863 people shows a moderate positive correlation between the proportion of Moroccans and percentage of single father households in the United States with a correlation coefficient (R) of 0.495 and weighted average of 2.2%, a difference of 31.2%.
Single Father Households Correlation Summary
| Measurement | Spanish American Indian | Moroccan |
| Minimum | 1.1% | 0.13% |
| Maximum | 5.5% | 9.4% |
| Range | 4.4% | 9.3% |
| Mean | 2.9% | 2.8% |
| Median | 2.8% | 2.3% |
| Interquartile 25% (IQ1) | 2.1% | 1.9% |
| Interquartile 75% (IQ3) | 3.4% | 2.9% |
| Interquartile Range (IQR) | 1.3% | 1.0% |
| Standard Deviation (Sample) | 1.1% | 1.9% |
| Standard Deviation (Population) | 1.0% | 1.9% |
Similar Demographics by Single Father Households
Demographics Similar to Spanish American Indians by Single Father Households
In terms of single father households, the demographic groups most similar to Spanish American Indians are Immigrants from Laos (2.9%, a difference of 0.48%), Tsimshian (2.9%, a difference of 0.57%), Central American (2.9%, a difference of 0.69%), Arapaho (2.9%, a difference of 0.99%), and Salvadoran (2.9%, a difference of 1.2%).
| Demographics | Rating | Rank | Single Father Households |
| Mexican American Indians | 0.0 /100 | #304 | Tragic 2.8% |
| Hispanics or Latinos | 0.0 /100 | #305 | Tragic 2.8% |
| Immigrants | Azores | 0.0 /100 | #306 | Tragic 2.8% |
| Hopi | 0.0 /100 | #307 | Tragic 2.8% |
| Apache | 0.0 /100 | #308 | Tragic 2.8% |
| Central Americans | 0.0 /100 | #309 | Tragic 2.9% |
| Immigrants | Laos | 0.0 /100 | #310 | Tragic 2.9% |
| Spanish American Indians | 0.0 /100 | #311 | Tragic 2.9% |
| Tsimshian | 0.0 /100 | #312 | Tragic 2.9% |
| Arapaho | 0.0 /100 | #313 | Tragic 2.9% |
| Salvadorans | 0.0 /100 | #314 | Tragic 2.9% |
| Cheyenne | 0.0 /100 | #315 | Tragic 2.9% |
| Houma | 0.0 /100 | #316 | Tragic 2.9% |
| Immigrants | El Salvador | 0.0 /100 | #317 | Tragic 2.9% |
| Cape Verdeans | 0.0 /100 | #318 | Tragic 2.9% |
Demographics Similar to Moroccans by Single Father Households
In terms of single father households, the demographic groups most similar to Moroccans are Jordanian (2.2%, a difference of 0.0%), Immigrants from England (2.2%, a difference of 0.050%), Serbian (2.2%, a difference of 0.060%), Immigrants from Chile (2.2%, a difference of 0.17%), and Immigrants from Jordan (2.2%, a difference of 0.23%).
| Demographics | Rating | Rank | Single Father Households |
| Trinidadians and Tobagonians | 97.8 /100 | #119 | Exceptional 2.2% |
| Australians | 97.7 /100 | #120 | Exceptional 2.2% |
| Immigrants | Brazil | 97.7 /100 | #121 | Exceptional 2.2% |
| Immigrants | Iraq | 97.6 /100 | #122 | Exceptional 2.2% |
| Immigrants | Yemen | 97.5 /100 | #123 | Exceptional 2.2% |
| British West Indians | 97.4 /100 | #124 | Exceptional 2.2% |
| Immigrants | Indonesia | 97.4 /100 | #125 | Exceptional 2.2% |
| Moroccans | 96.9 /100 | #126 | Exceptional 2.2% |
| Jordanians | 96.9 /100 | #127 | Exceptional 2.2% |
| Immigrants | England | 96.8 /100 | #128 | Exceptional 2.2% |
| Serbians | 96.8 /100 | #129 | Exceptional 2.2% |
| Immigrants | Chile | 96.7 /100 | #130 | Exceptional 2.2% |
| Immigrants | Jordan | 96.6 /100 | #131 | Exceptional 2.2% |
| Poles | 96.5 /100 | #132 | Exceptional 2.2% |
| Taiwanese | 96.3 /100 | #133 | Exceptional 2.2% |