Immigrants from Guyana vs Moroccan Single Father Households
COMPARE
Immigrants from Guyana
Moroccan
Single Father Households
Single Father Households Comparison
Immigrants from Guyana
Moroccans
2.1%
SINGLE FATHER HOUSEHOLDS
99.4/ 100
METRIC RATING
91st/ 347
METRIC RANK
2.2%
SINGLE FATHER HOUSEHOLDS
96.9/ 100
METRIC RATING
126th/ 347
METRIC RANK
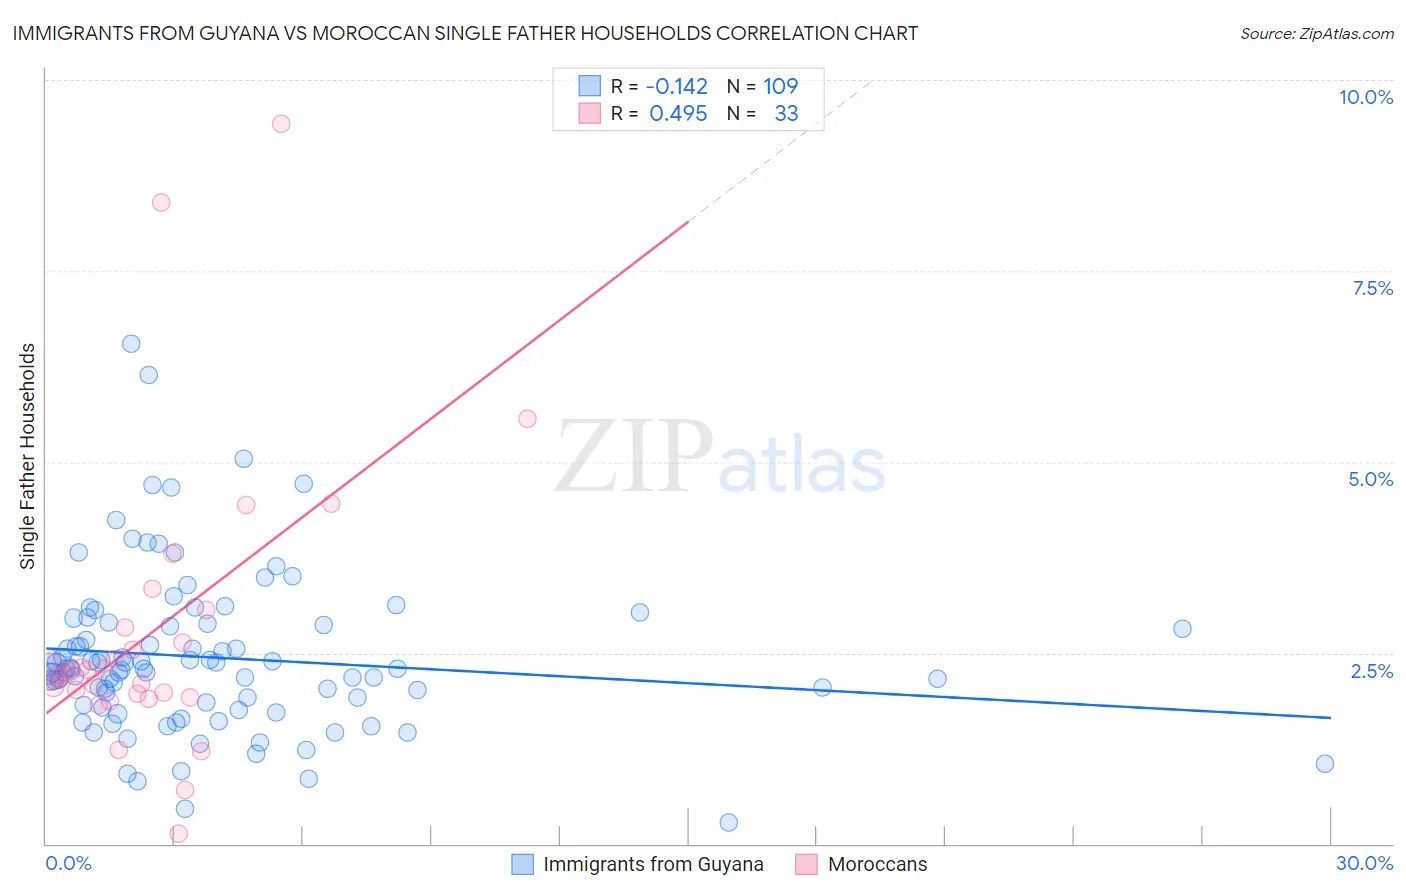
Immigrants from Guyana vs Moroccan Single Father Households Correlation Chart
The statistical analysis conducted on geographies consisting of 182,864,099 people shows a poor negative correlation between the proportion of Immigrants from Guyana and percentage of single father households in the United States with a correlation coefficient (R) of -0.142 and weighted average of 2.1%. Similarly, the statistical analysis conducted on geographies consisting of 201,125,863 people shows a moderate positive correlation between the proportion of Moroccans and percentage of single father households in the United States with a correlation coefficient (R) of 0.495 and weighted average of 2.2%, a difference of 3.3%.
Single Father Households Correlation Summary
| Measurement | Immigrants from Guyana | Moroccan |
| Minimum | 0.28% | 0.13% |
| Maximum | 6.5% | 9.4% |
| Range | 6.3% | 9.3% |
| Mean | 2.4% | 2.8% |
| Median | 2.3% | 2.3% |
| Interquartile 25% (IQ1) | 1.8% | 1.9% |
| Interquartile 75% (IQ3) | 2.9% | 2.9% |
| Interquartile Range (IQR) | 1.0% | 1.0% |
| Standard Deviation (Sample) | 1.0% | 1.9% |
| Standard Deviation (Population) | 1.0% | 1.9% |
Similar Demographics by Single Father Households
Demographics Similar to Immigrants from Guyana by Single Father Households
In terms of single father households, the demographic groups most similar to Immigrants from Guyana are Romanian (2.1%, a difference of 0.090%), Croatian (2.1%, a difference of 0.20%), Ukrainian (2.1%, a difference of 0.20%), Immigrants from Pakistan (2.1%, a difference of 0.24%), and Immigrants from Armenia (2.1%, a difference of 0.25%).
| Demographics | Rating | Rank | Single Father Households |
| Carpatho Rusyns | 99.6 /100 | #84 | Exceptional 2.1% |
| Immigrants | Hungary | 99.6 /100 | #85 | Exceptional 2.1% |
| Asians | 99.6 /100 | #86 | Exceptional 2.1% |
| Lithuanians | 99.5 /100 | #87 | Exceptional 2.1% |
| Bhutanese | 99.5 /100 | #88 | Exceptional 2.1% |
| Immigrants | Armenia | 99.5 /100 | #89 | Exceptional 2.1% |
| Immigrants | Pakistan | 99.5 /100 | #90 | Exceptional 2.1% |
| Immigrants | Guyana | 99.4 /100 | #91 | Exceptional 2.1% |
| Romanians | 99.4 /100 | #92 | Exceptional 2.1% |
| Croatians | 99.3 /100 | #93 | Exceptional 2.1% |
| Ukrainians | 99.3 /100 | #94 | Exceptional 2.1% |
| Bermudans | 99.2 /100 | #95 | Exceptional 2.1% |
| Arabs | 99.2 /100 | #96 | Exceptional 2.1% |
| Immigrants | Moldova | 99.1 /100 | #97 | Exceptional 2.1% |
| Guyanese | 99.1 /100 | #98 | Exceptional 2.1% |
Demographics Similar to Moroccans by Single Father Households
In terms of single father households, the demographic groups most similar to Moroccans are Jordanian (2.2%, a difference of 0.0%), Immigrants from England (2.2%, a difference of 0.050%), Serbian (2.2%, a difference of 0.060%), Immigrants from Chile (2.2%, a difference of 0.17%), and Immigrants from Jordan (2.2%, a difference of 0.23%).
| Demographics | Rating | Rank | Single Father Households |
| Trinidadians and Tobagonians | 97.8 /100 | #119 | Exceptional 2.2% |
| Australians | 97.7 /100 | #120 | Exceptional 2.2% |
| Immigrants | Brazil | 97.7 /100 | #121 | Exceptional 2.2% |
| Immigrants | Iraq | 97.6 /100 | #122 | Exceptional 2.2% |
| Immigrants | Yemen | 97.5 /100 | #123 | Exceptional 2.2% |
| British West Indians | 97.4 /100 | #124 | Exceptional 2.2% |
| Immigrants | Indonesia | 97.4 /100 | #125 | Exceptional 2.2% |
| Moroccans | 96.9 /100 | #126 | Exceptional 2.2% |
| Jordanians | 96.9 /100 | #127 | Exceptional 2.2% |
| Immigrants | England | 96.8 /100 | #128 | Exceptional 2.2% |
| Serbians | 96.8 /100 | #129 | Exceptional 2.2% |
| Immigrants | Chile | 96.7 /100 | #130 | Exceptional 2.2% |
| Immigrants | Jordan | 96.6 /100 | #131 | Exceptional 2.2% |
| Poles | 96.5 /100 | #132 | Exceptional 2.2% |
| Taiwanese | 96.3 /100 | #133 | Exceptional 2.2% |