Mongolian vs Moroccan In Labor Force | Age 35-44
COMPARE
Mongolian
Moroccan
In Labor Force | Age 35-44
In Labor Force | Age 35-44 Comparison
Mongolians
Moroccans
84.8%
IN LABOR FORCE | AGE 35-44
96.8/ 100
METRIC RATING
94th/ 347
METRIC RANK
84.2%
IN LABOR FORCE | AGE 35-44
23.2/ 100
METRIC RATING
200th/ 347
METRIC RANK
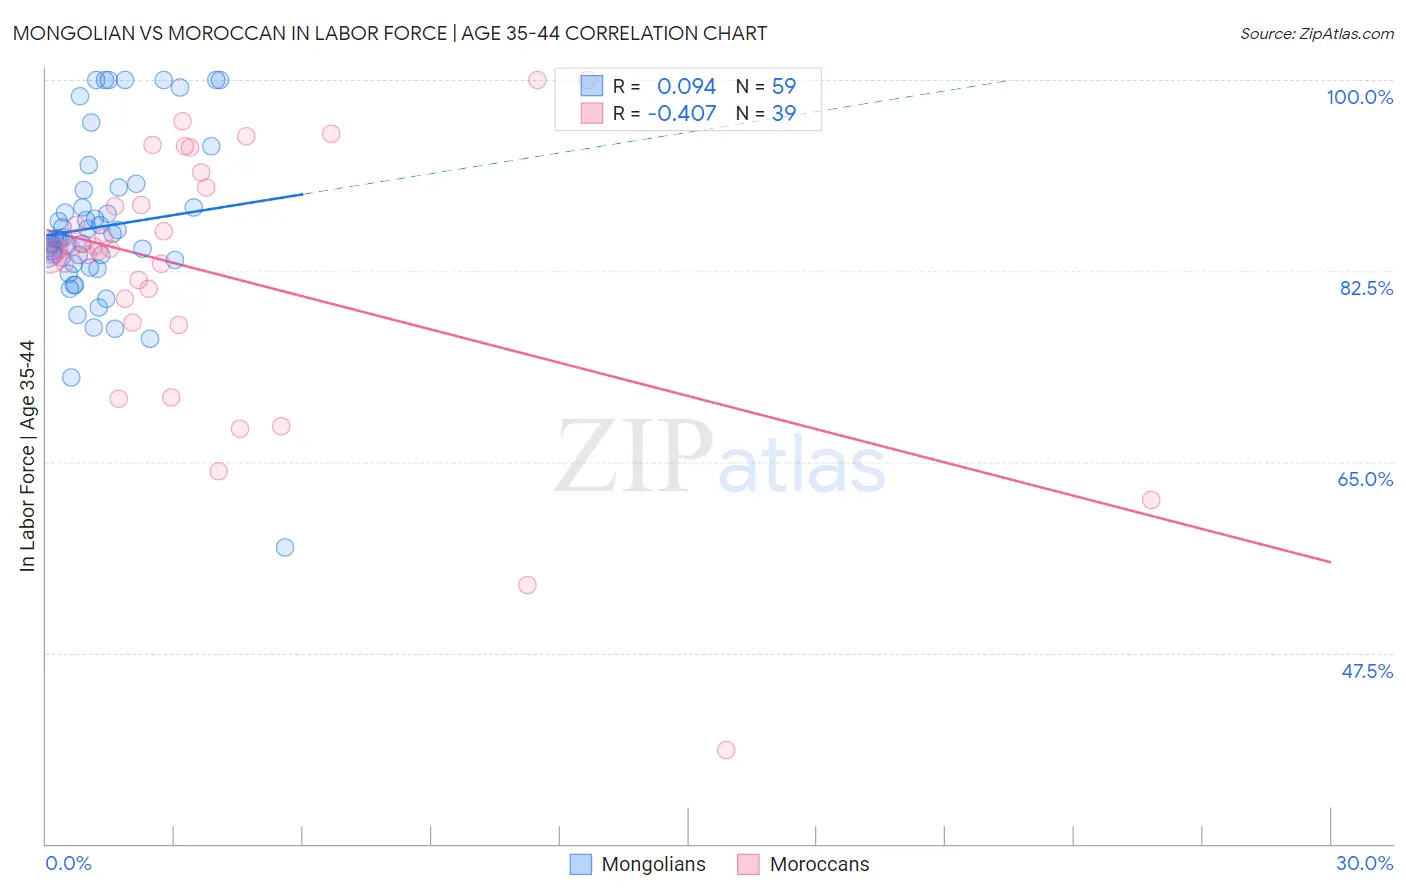
Mongolian vs Moroccan In Labor Force | Age 35-44 Correlation Chart
The statistical analysis conducted on geographies consisting of 140,321,918 people shows a slight positive correlation between the proportion of Mongolians and labor force participation rate among population between the ages 35 and 44 in the United States with a correlation coefficient (R) of 0.094 and weighted average of 84.8%. Similarly, the statistical analysis conducted on geographies consisting of 201,769,672 people shows a moderate negative correlation between the proportion of Moroccans and labor force participation rate among population between the ages 35 and 44 in the United States with a correlation coefficient (R) of -0.407 and weighted average of 84.2%, a difference of 0.75%.
In Labor Force | Age 35-44 Correlation Summary
| Measurement | Mongolian | Moroccan |
| Minimum | 57.1% | 38.6% |
| Maximum | 100.0% | 100.0% |
| Range | 42.9% | 61.4% |
| Mean | 86.6% | 82.2% |
| Median | 85.4% | 84.5% |
| Interquartile 25% (IQ1) | 83.2% | 77.7% |
| Interquartile 75% (IQ3) | 89.9% | 90.1% |
| Interquartile Range (IQR) | 6.8% | 12.4% |
| Standard Deviation (Sample) | 7.8% | 12.6% |
| Standard Deviation (Population) | 7.7% | 12.5% |
Similar Demographics by In Labor Force | Age 35-44
Demographics Similar to Mongolians by In Labor Force | Age 35-44
In terms of in labor force | age 35-44, the demographic groups most similar to Mongolians are Immigrants from Kuwait (84.8%, a difference of 0.010%), Cuban (84.8%, a difference of 0.010%), Egyptian (84.8%, a difference of 0.010%), Immigrants from Europe (84.9%, a difference of 0.020%), and Ghanaian (84.8%, a difference of 0.020%).
| Demographics | Rating | Rank | In Labor Force | Age 35-44 |
| Belgians | 97.7 /100 | #87 | Exceptional 84.9% |
| Yugoslavians | 97.7 /100 | #88 | Exceptional 84.9% |
| Immigrants | Pakistan | 97.5 /100 | #89 | Exceptional 84.9% |
| Immigrants | France | 97.4 /100 | #90 | Exceptional 84.9% |
| Immigrants | Europe | 97.2 /100 | #91 | Exceptional 84.9% |
| Ghanaians | 97.2 /100 | #92 | Exceptional 84.8% |
| Immigrants | Northern Africa | 97.1 /100 | #93 | Exceptional 84.8% |
| Mongolians | 96.8 /100 | #94 | Exceptional 84.8% |
| Immigrants | Kuwait | 96.7 /100 | #95 | Exceptional 84.8% |
| Cubans | 96.6 /100 | #96 | Exceptional 84.8% |
| Egyptians | 96.6 /100 | #97 | Exceptional 84.8% |
| Indians (Asian) | 96.1 /100 | #98 | Exceptional 84.8% |
| Haitians | 96.0 /100 | #99 | Exceptional 84.8% |
| Immigrants | Czechoslovakia | 95.9 /100 | #100 | Exceptional 84.8% |
| Immigrants | Australia | 95.5 /100 | #101 | Exceptional 84.8% |
Demographics Similar to Moroccans by In Labor Force | Age 35-44
In terms of in labor force | age 35-44, the demographic groups most similar to Moroccans are Syrian (84.2%, a difference of 0.0%), British (84.2%, a difference of 0.0%), Immigrants from Uzbekistan (84.2%, a difference of 0.0%), Immigrants from Western Europe (84.2%, a difference of 0.010%), and Ecuadorian (84.2%, a difference of 0.010%).
| Demographics | Rating | Rank | In Labor Force | Age 35-44 |
| Hungarians | 26.8 /100 | #193 | Fair 84.2% |
| Immigrants | Indonesia | 25.7 /100 | #194 | Fair 84.2% |
| Immigrants | Caribbean | 25.7 /100 | #195 | Fair 84.2% |
| Immigrants | England | 25.0 /100 | #196 | Fair 84.2% |
| Immigrants | Western Europe | 24.7 /100 | #197 | Fair 84.2% |
| Ecuadorians | 24.0 /100 | #198 | Fair 84.2% |
| Syrians | 23.2 /100 | #199 | Fair 84.2% |
| Moroccans | 23.2 /100 | #200 | Fair 84.2% |
| British | 23.0 /100 | #201 | Fair 84.2% |
| Immigrants | Uzbekistan | 22.8 /100 | #202 | Fair 84.2% |
| Immigrants | South Eastern Asia | 22.4 /100 | #203 | Fair 84.2% |
| Canadians | 19.9 /100 | #204 | Poor 84.2% |
| Immigrants | Canada | 19.6 /100 | #205 | Poor 84.2% |
| Immigrants | Costa Rica | 19.5 /100 | #206 | Poor 84.2% |
| Laotians | 19.0 /100 | #207 | Poor 84.2% |