Mongolian vs Immigrants from Moldova Family Households
COMPARE
Mongolian
Immigrants from Moldova
Family Households
Family Households Comparison
Mongolians
Immigrants from Moldova
62.8%
FAMILY HOUSEHOLDS
0.1/ 100
METRIC RATING
285th/ 347
METRIC RANK
64.4%
FAMILY HOUSEHOLDS
65.2/ 100
METRIC RATING
160th/ 347
METRIC RANK
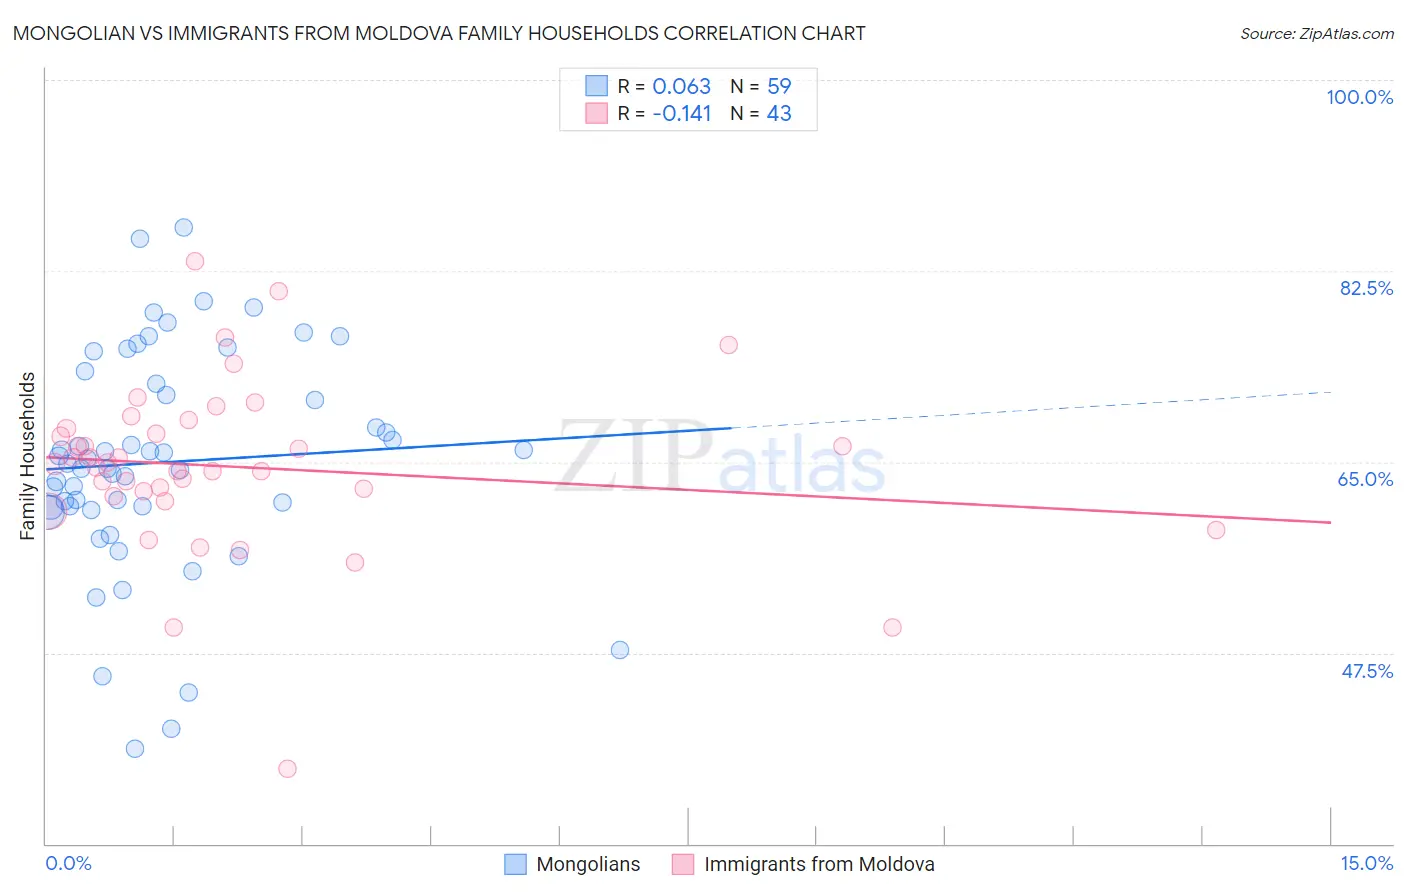
Mongolian vs Immigrants from Moldova Family Households Correlation Chart
The statistical analysis conducted on geographies consisting of 140,293,840 people shows a slight positive correlation between the proportion of Mongolians and percentage of family households in the United States with a correlation coefficient (R) of 0.063 and weighted average of 62.8%. Similarly, the statistical analysis conducted on geographies consisting of 124,364,803 people shows a poor negative correlation between the proportion of Immigrants from Moldova and percentage of family households in the United States with a correlation coefficient (R) of -0.141 and weighted average of 64.4%, a difference of 2.6%.
Family Households Correlation Summary
| Measurement | Mongolian | Immigrants from Moldova |
| Minimum | 38.8% | 36.9% |
| Maximum | 86.5% | 83.4% |
| Range | 47.8% | 46.5% |
| Mean | 65.0% | 64.5% |
| Median | 64.9% | 64.8% |
| Interquartile 25% (IQ1) | 60.9% | 61.9% |
| Interquartile 75% (IQ3) | 72.2% | 68.1% |
| Interquartile Range (IQR) | 11.3% | 6.2% |
| Standard Deviation (Sample) | 10.1% | 8.0% |
| Standard Deviation (Population) | 10.0% | 7.9% |
Similar Demographics by Family Households
Demographics Similar to Mongolians by Family Households
In terms of family households, the demographic groups most similar to Mongolians are British West Indian (62.8%, a difference of 0.030%), Latvian (62.8%, a difference of 0.030%), Immigrants from Uganda (62.7%, a difference of 0.050%), Australian (62.8%, a difference of 0.10%), and Immigrants from Nepal (62.7%, a difference of 0.14%).
| Demographics | Rating | Rank | Family Households |
| Immigrants | Belgium | 0.2 /100 | #278 | Tragic 63.0% |
| Immigrants | Yemen | 0.2 /100 | #279 | Tragic 63.0% |
| Immigrants | Bulgaria | 0.2 /100 | #280 | Tragic 63.0% |
| Estonians | 0.2 /100 | #281 | Tragic 62.9% |
| New Zealanders | 0.1 /100 | #282 | Tragic 62.9% |
| Immigrants | Denmark | 0.1 /100 | #283 | Tragic 62.9% |
| Australians | 0.1 /100 | #284 | Tragic 62.8% |
| Mongolians | 0.1 /100 | #285 | Tragic 62.8% |
| British West Indians | 0.1 /100 | #286 | Tragic 62.8% |
| Latvians | 0.1 /100 | #287 | Tragic 62.8% |
| Immigrants | Uganda | 0.1 /100 | #288 | Tragic 62.7% |
| Immigrants | Nepal | 0.1 /100 | #289 | Tragic 62.7% |
| Immigrants | Grenada | 0.0 /100 | #290 | Tragic 62.6% |
| U.S. Virgin Islanders | 0.0 /100 | #291 | Tragic 62.6% |
| Immigrants | Burma/Myanmar | 0.0 /100 | #292 | Tragic 62.6% |
Demographics Similar to Immigrants from Moldova by Family Households
In terms of family households, the demographic groups most similar to Immigrants from Moldova are German (64.4%, a difference of 0.010%), Canadian (64.4%, a difference of 0.020%), Lebanese (64.4%, a difference of 0.020%), Czech (64.5%, a difference of 0.030%), and Uruguayan (64.5%, a difference of 0.040%).
| Demographics | Rating | Rank | Family Households |
| Swedes | 69.8 /100 | #153 | Good 64.5% |
| Austrians | 68.5 /100 | #154 | Good 64.5% |
| Uruguayans | 67.7 /100 | #155 | Good 64.5% |
| Czechs | 67.0 /100 | #156 | Good 64.5% |
| Canadians | 66.6 /100 | #157 | Good 64.4% |
| Lebanese | 66.4 /100 | #158 | Good 64.4% |
| Germans | 65.8 /100 | #159 | Good 64.4% |
| Immigrants | Moldova | 65.2 /100 | #160 | Good 64.4% |
| Immigrants | England | 62.6 /100 | #161 | Good 64.4% |
| British | 61.6 /100 | #162 | Good 64.4% |
| Chickasaw | 61.5 /100 | #163 | Good 64.4% |
| Immigrants | Nigeria | 60.1 /100 | #164 | Good 64.4% |
| Immigrants | Southern Europe | 60.0 /100 | #165 | Good 64.4% |
| Scotch-Irish | 59.2 /100 | #166 | Average 64.4% |
| Irish | 57.9 /100 | #167 | Average 64.4% |