Immigrants from Japan vs Menominee Family Households
COMPARE
Immigrants from Japan
Menominee
Family Households
Family Households Comparison
Immigrants from Japan
Menominee
63.4%
FAMILY HOUSEHOLDS
1.4/ 100
METRIC RATING
250th/ 347
METRIC RANK
66.5%
FAMILY HOUSEHOLDS
100.0/ 100
METRIC RATING
42nd/ 347
METRIC RANK
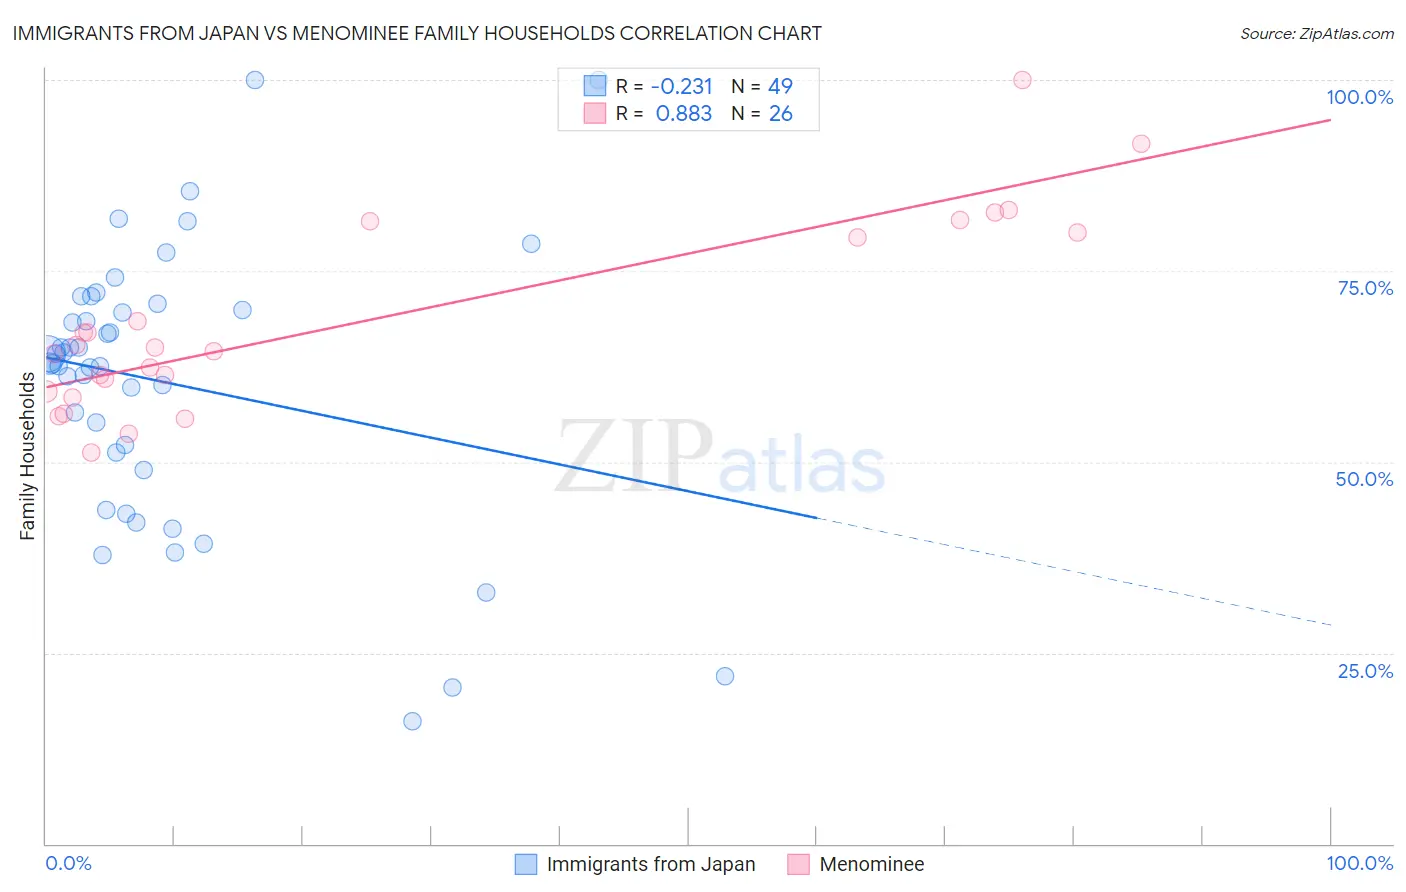
Immigrants from Japan vs Menominee Family Households Correlation Chart
The statistical analysis conducted on geographies consisting of 339,993,519 people shows a weak negative correlation between the proportion of Immigrants from Japan and percentage of family households in the United States with a correlation coefficient (R) of -0.231 and weighted average of 63.4%. Similarly, the statistical analysis conducted on geographies consisting of 45,777,849 people shows a very strong positive correlation between the proportion of Menominee and percentage of family households in the United States with a correlation coefficient (R) of 0.883 and weighted average of 66.5%, a difference of 5.0%.
Family Households Correlation Summary
| Measurement | Immigrants from Japan | Menominee |
| Minimum | 16.1% | 51.3% |
| Maximum | 100.0% | 100.0% |
| Range | 83.9% | 48.7% |
| Mean | 60.4% | 68.4% |
| Median | 62.8% | 64.8% |
| Interquartile 25% (IQ1) | 50.1% | 59.2% |
| Interquartile 75% (IQ3) | 70.3% | 80.0% |
| Interquartile Range (IQR) | 20.2% | 20.8% |
| Standard Deviation (Sample) | 17.9% | 12.6% |
| Standard Deviation (Population) | 17.7% | 12.4% |
Similar Demographics by Family Households
Demographics Similar to Immigrants from Japan by Family Households
In terms of family households, the demographic groups most similar to Immigrants from Japan are Russian (63.4%, a difference of 0.010%), Dominican (63.4%, a difference of 0.030%), Immigrants from Uzbekistan (63.4%, a difference of 0.040%), Immigrants from Ghana (63.4%, a difference of 0.050%), and Taiwanese (63.3%, a difference of 0.050%).
| Demographics | Rating | Rank | Family Households |
| Immigrants | Czechoslovakia | 1.8 /100 | #243 | Tragic 63.4% |
| Eastern Europeans | 1.6 /100 | #244 | Tragic 63.4% |
| Immigrants | Dominica | 1.6 /100 | #245 | Tragic 63.4% |
| Immigrants | Ghana | 1.6 /100 | #246 | Tragic 63.4% |
| Immigrants | Uzbekistan | 1.5 /100 | #247 | Tragic 63.4% |
| Dominicans | 1.5 /100 | #248 | Tragic 63.4% |
| Russians | 1.4 /100 | #249 | Tragic 63.4% |
| Immigrants | Japan | 1.4 /100 | #250 | Tragic 63.4% |
| Taiwanese | 1.2 /100 | #251 | Tragic 63.3% |
| Bahamians | 1.1 /100 | #252 | Tragic 63.3% |
| Immigrants | Dominican Republic | 1.0 /100 | #253 | Tragic 63.3% |
| Slovaks | 1.0 /100 | #254 | Tragic 63.3% |
| Potawatomi | 1.0 /100 | #255 | Tragic 63.3% |
| Luxembourgers | 0.9 /100 | #256 | Tragic 63.3% |
| Icelanders | 0.8 /100 | #257 | Tragic 63.3% |
Demographics Similar to Menominee by Family Households
In terms of family households, the demographic groups most similar to Menominee are Apache (66.5%, a difference of 0.010%), Immigrants from Bolivia (66.6%, a difference of 0.060%), Asian (66.5%, a difference of 0.060%), Venezuelan (66.5%, a difference of 0.080%), and Guamanian/Chamorro (66.6%, a difference of 0.090%).
| Demographics | Rating | Rank | Family Households |
| Tohono O'odham | 100.0 /100 | #35 | Exceptional 67.1% |
| Peruvians | 100.0 /100 | #36 | Exceptional 67.1% |
| Tsimshian | 100.0 /100 | #37 | Exceptional 67.1% |
| Mexican American Indians | 100.0 /100 | #38 | Exceptional 67.0% |
| Immigrants | El Salvador | 100.0 /100 | #39 | Exceptional 67.0% |
| Guamanians/Chamorros | 100.0 /100 | #40 | Exceptional 66.6% |
| Immigrants | Bolivia | 100.0 /100 | #41 | Exceptional 66.6% |
| Menominee | 100.0 /100 | #42 | Exceptional 66.5% |
| Apache | 100.0 /100 | #43 | Exceptional 66.5% |
| Asians | 100.0 /100 | #44 | Exceptional 66.5% |
| Venezuelans | 100.0 /100 | #45 | Exceptional 66.5% |
| Arapaho | 100.0 /100 | #46 | Exceptional 66.5% |
| Bolivians | 100.0 /100 | #47 | Exceptional 66.5% |
| Immigrants | Venezuela | 100.0 /100 | #48 | Exceptional 66.4% |
| Immigrants | South Central Asia | 100.0 /100 | #49 | Exceptional 66.4% |