Ukrainian vs Immigrants from Moldova Family Households
COMPARE
Ukrainian
Immigrants from Moldova
Family Households
Family Households Comparison
Ukrainians
Immigrants from Moldova
64.2%
FAMILY HOUSEHOLDS
34.6/ 100
METRIC RATING
182nd/ 347
METRIC RANK
64.4%
FAMILY HOUSEHOLDS
65.2/ 100
METRIC RATING
160th/ 347
METRIC RANK
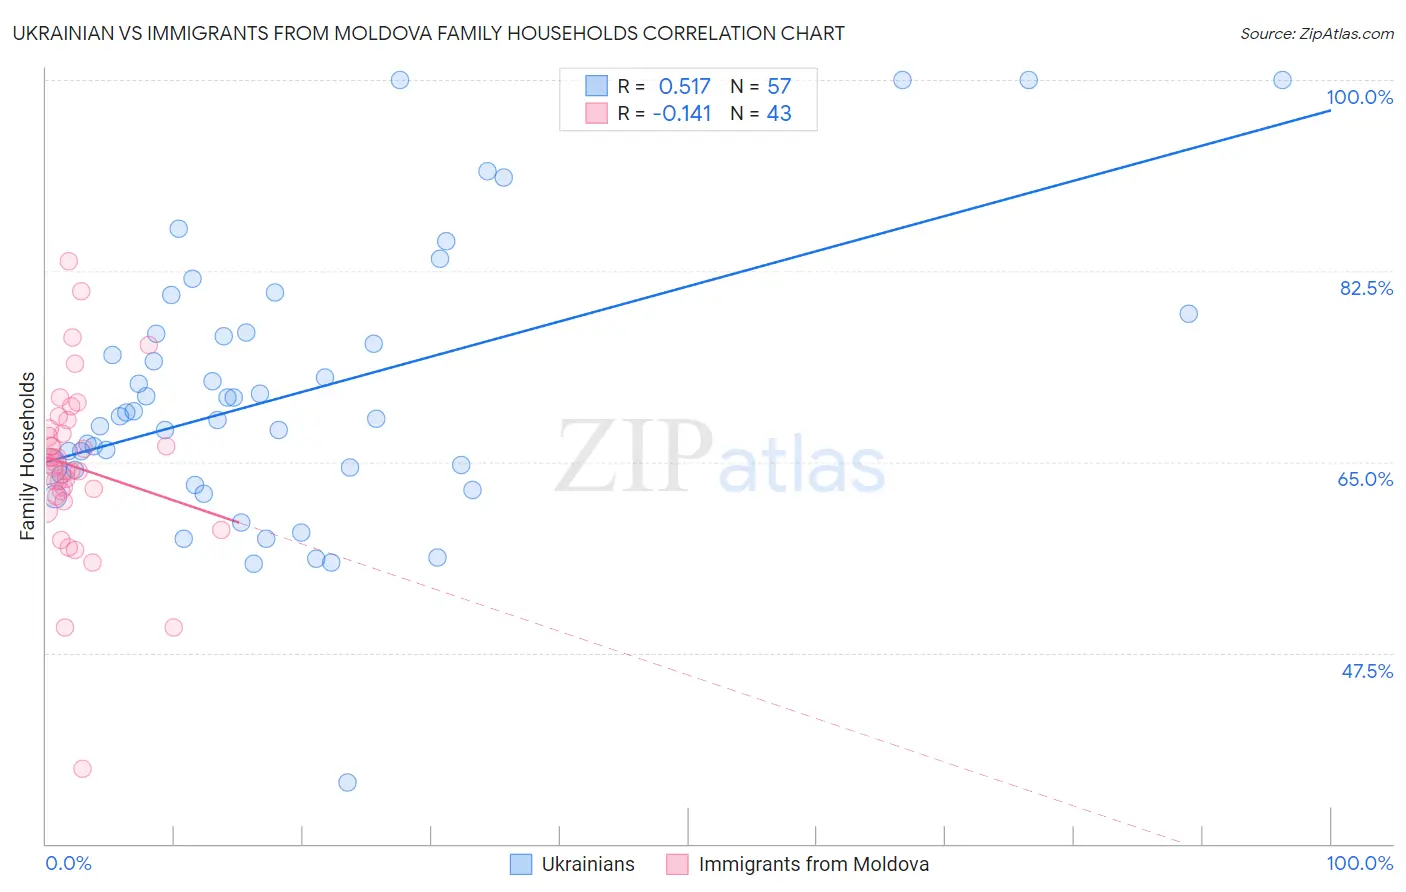
Ukrainian vs Immigrants from Moldova Family Households Correlation Chart
The statistical analysis conducted on geographies consisting of 448,323,660 people shows a substantial positive correlation between the proportion of Ukrainians and percentage of family households in the United States with a correlation coefficient (R) of 0.517 and weighted average of 64.2%. Similarly, the statistical analysis conducted on geographies consisting of 124,364,803 people shows a poor negative correlation between the proportion of Immigrants from Moldova and percentage of family households in the United States with a correlation coefficient (R) of -0.141 and weighted average of 64.4%, a difference of 0.43%.
Family Households Correlation Summary
| Measurement | Ukrainian | Immigrants from Moldova |
| Minimum | 35.6% | 36.9% |
| Maximum | 100.0% | 83.4% |
| Range | 64.4% | 46.5% |
| Mean | 71.3% | 64.5% |
| Median | 69.2% | 64.8% |
| Interquartile 25% (IQ1) | 64.0% | 61.9% |
| Interquartile 75% (IQ3) | 76.8% | 68.1% |
| Interquartile Range (IQR) | 12.8% | 6.2% |
| Standard Deviation (Sample) | 12.5% | 8.0% |
| Standard Deviation (Population) | 12.4% | 7.9% |
Similar Demographics by Family Households
Demographics Similar to Ukrainians by Family Households
In terms of family households, the demographic groups most similar to Ukrainians are Immigrants from Honduras (64.2%, a difference of 0.0%), Immigrants from Trinidad and Tobago (64.2%, a difference of 0.0%), Creek (64.2%, a difference of 0.010%), Puerto Rican (64.2%, a difference of 0.020%), and Immigrants from Ukraine (64.2%, a difference of 0.050%).
| Demographics | Rating | Rank | Family Households |
| Bangladeshis | 44.3 /100 | #175 | Average 64.3% |
| Vietnamese | 43.6 /100 | #176 | Average 64.2% |
| Immigrants | Micronesia | 42.3 /100 | #177 | Average 64.2% |
| Jamaicans | 40.6 /100 | #178 | Average 64.2% |
| Immigrants | Ukraine | 38.2 /100 | #179 | Fair 64.2% |
| Immigrants | Honduras | 35.0 /100 | #180 | Fair 64.2% |
| Immigrants | Trinidad and Tobago | 34.9 /100 | #181 | Fair 64.2% |
| Ukrainians | 34.6 /100 | #182 | Fair 64.2% |
| Creek | 34.1 /100 | #183 | Fair 64.2% |
| Puerto Ricans | 33.4 /100 | #184 | Fair 64.2% |
| Immigrants | Iran | 30.4 /100 | #185 | Fair 64.1% |
| Spanish Americans | 30.1 /100 | #186 | Fair 64.1% |
| Northern Europeans | 28.2 /100 | #187 | Fair 64.1% |
| Paraguayans | 26.7 /100 | #188 | Fair 64.1% |
| Immigrants | Western Asia | 25.3 /100 | #189 | Fair 64.1% |
Demographics Similar to Immigrants from Moldova by Family Households
In terms of family households, the demographic groups most similar to Immigrants from Moldova are German (64.4%, a difference of 0.010%), Canadian (64.4%, a difference of 0.020%), Lebanese (64.4%, a difference of 0.020%), Czech (64.5%, a difference of 0.030%), and Uruguayan (64.5%, a difference of 0.040%).
| Demographics | Rating | Rank | Family Households |
| Swedes | 69.8 /100 | #153 | Good 64.5% |
| Austrians | 68.5 /100 | #154 | Good 64.5% |
| Uruguayans | 67.7 /100 | #155 | Good 64.5% |
| Czechs | 67.0 /100 | #156 | Good 64.5% |
| Canadians | 66.6 /100 | #157 | Good 64.4% |
| Lebanese | 66.4 /100 | #158 | Good 64.4% |
| Germans | 65.8 /100 | #159 | Good 64.4% |
| Immigrants | Moldova | 65.2 /100 | #160 | Good 64.4% |
| Immigrants | England | 62.6 /100 | #161 | Good 64.4% |
| British | 61.6 /100 | #162 | Good 64.4% |
| Chickasaw | 61.5 /100 | #163 | Good 64.4% |
| Immigrants | Nigeria | 60.1 /100 | #164 | Good 64.4% |
| Immigrants | Southern Europe | 60.0 /100 | #165 | Good 64.4% |
| Scotch-Irish | 59.2 /100 | #166 | Average 64.4% |
| Irish | 57.9 /100 | #167 | Average 64.4% |