Mongolian vs Immigrants from Moldova Unemployment Among Ages 35 to 44 years
COMPARE
Mongolian
Immigrants from Moldova
Unemployment Among Ages 35 to 44 years
Unemployment Among Ages 35 to 44 years Comparison
Mongolians
Immigrants from Moldova
4.3%
UNEMPLOYMENT AMONG AGES 35 TO 44 YEARS
98.9/ 100
METRIC RATING
36th/ 347
METRIC RANK
4.4%
UNEMPLOYMENT AMONG AGES 35 TO 44 YEARS
97.3/ 100
METRIC RATING
55th/ 347
METRIC RANK
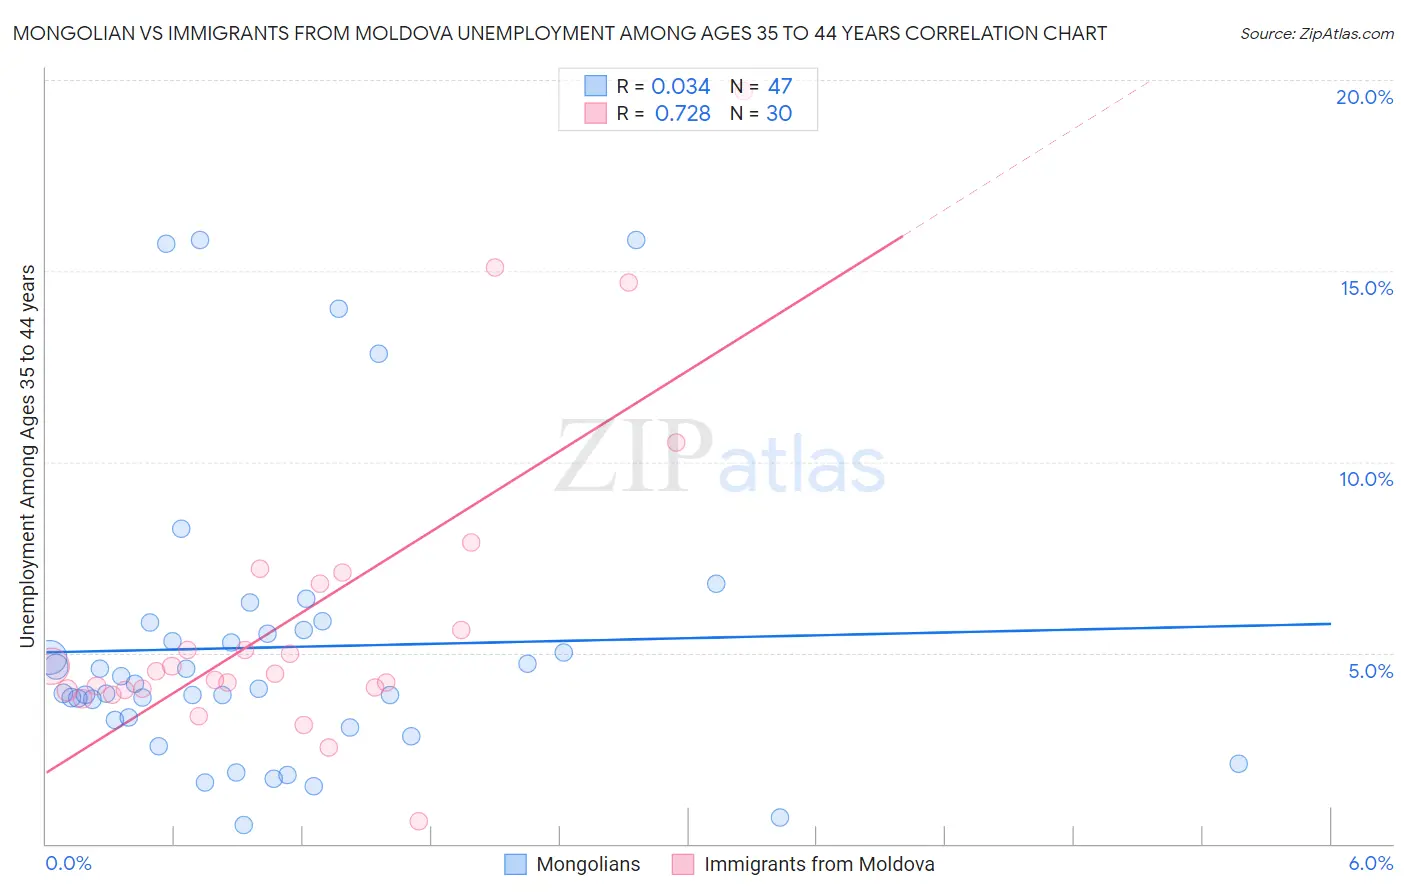
Mongolian vs Immigrants from Moldova Unemployment Among Ages 35 to 44 years Correlation Chart
The statistical analysis conducted on geographies consisting of 139,488,887 people shows no correlation between the proportion of Mongolians and unemployment rate among population between the ages 35 and 44 in the United States with a correlation coefficient (R) of 0.034 and weighted average of 4.3%. Similarly, the statistical analysis conducted on geographies consisting of 123,470,953 people shows a strong positive correlation between the proportion of Immigrants from Moldova and unemployment rate among population between the ages 35 and 44 in the United States with a correlation coefficient (R) of 0.728 and weighted average of 4.4%, a difference of 1.8%.
Unemployment Among Ages 35 to 44 years Correlation Summary
| Measurement | Mongolian | Immigrants from Moldova |
| Minimum | 0.50% | 0.60% |
| Maximum | 15.8% | 19.7% |
| Range | 15.3% | 19.1% |
| Mean | 5.1% | 5.9% |
| Median | 4.1% | 4.5% |
| Interquartile 25% (IQ1) | 3.2% | 4.0% |
| Interquartile 75% (IQ3) | 5.6% | 6.8% |
| Interquartile Range (IQR) | 2.4% | 2.8% |
| Standard Deviation (Sample) | 3.7% | 4.1% |
| Standard Deviation (Population) | 3.7% | 4.0% |
Demographics Similar to Mongolians and Immigrants from Moldova by Unemployment Among Ages 35 to 44 years
In terms of unemployment among ages 35 to 44 years, the demographic groups most similar to Mongolians are Immigrants from Zimbabwe (4.3%, a difference of 0.050%), Luxembourger (4.3%, a difference of 0.10%), Burmese (4.3%, a difference of 0.12%), Palestinian (4.3%, a difference of 0.17%), and Zimbabwean (4.3%, a difference of 0.23%). Similarly, the demographic groups most similar to Immigrants from Moldova are Asian (4.4%, a difference of 0.030%), Immigrants from Argentina (4.4%, a difference of 0.19%), Okinawan (4.4%, a difference of 0.33%), Immigrants from Eastern Asia (4.4%, a difference of 0.35%), and Immigrants from Turkey (4.4%, a difference of 0.37%).
| Demographics | Rating | Rank | Unemployment Among Ages 35 to 44 years |
| Luxembourgers | 99.0 /100 | #35 | Exceptional 4.3% |
| Mongolians | 98.9 /100 | #36 | Exceptional 4.3% |
| Immigrants | Zimbabwe | 98.9 /100 | #37 | Exceptional 4.3% |
| Burmese | 98.9 /100 | #38 | Exceptional 4.3% |
| Palestinians | 98.8 /100 | #39 | Exceptional 4.3% |
| Zimbabweans | 98.8 /100 | #40 | Exceptional 4.3% |
| Belgians | 98.7 /100 | #41 | Exceptional 4.3% |
| Germans | 98.7 /100 | #42 | Exceptional 4.3% |
| Eastern Europeans | 98.7 /100 | #43 | Exceptional 4.3% |
| Immigrants | Malaysia | 98.7 /100 | #44 | Exceptional 4.3% |
| Immigrants | Korea | 98.4 /100 | #45 | Exceptional 4.3% |
| Immigrants | Belgium | 98.4 /100 | #46 | Exceptional 4.3% |
| British | 98.3 /100 | #47 | Exceptional 4.4% |
| Bhutanese | 98.2 /100 | #48 | Exceptional 4.4% |
| Swiss | 98.2 /100 | #49 | Exceptional 4.4% |
| Immigrants | Turkey | 97.8 /100 | #50 | Exceptional 4.4% |
| Immigrants | Eastern Asia | 97.8 /100 | #51 | Exceptional 4.4% |
| Okinawans | 97.7 /100 | #52 | Exceptional 4.4% |
| Immigrants | Argentina | 97.6 /100 | #53 | Exceptional 4.4% |
| Asians | 97.4 /100 | #54 | Exceptional 4.4% |
| Immigrants | Moldova | 97.3 /100 | #55 | Exceptional 4.4% |