Cree vs Luxembourger Single Father Households
COMPARE
Cree
Luxembourger
Single Father Households
Single Father Households Comparison
Cree
Luxembourgers
2.8%
SINGLE FATHER HOUSEHOLDS
0.0/ 100
METRIC RATING
298th/ 347
METRIC RANK
2.2%
SINGLE FATHER HOUSEHOLDS
92.3/ 100
METRIC RATING
142nd/ 347
METRIC RANK
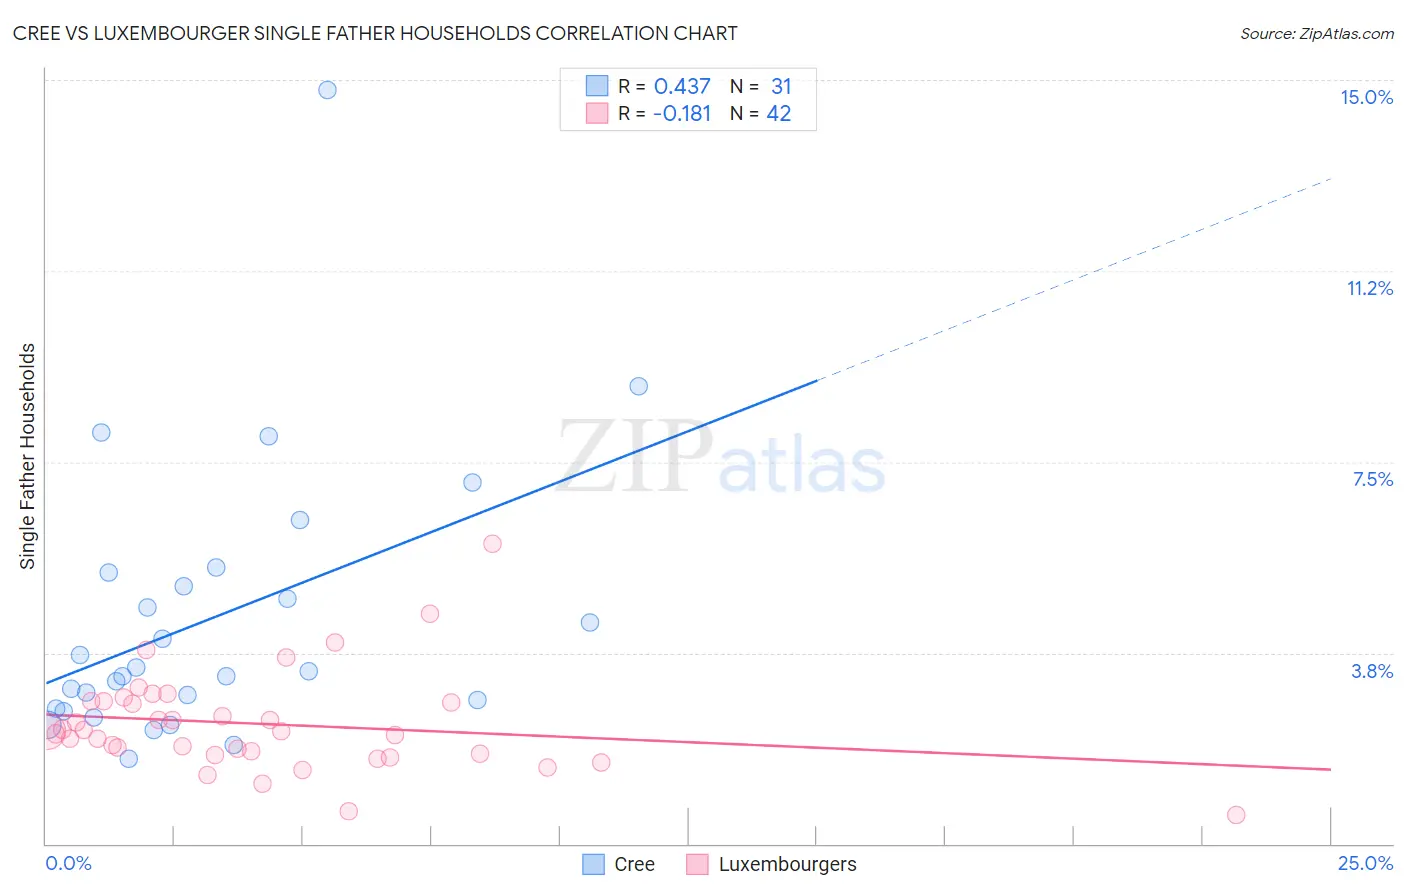
Cree vs Luxembourger Single Father Households Correlation Chart
The statistical analysis conducted on geographies consisting of 76,112,534 people shows a moderate positive correlation between the proportion of Cree and percentage of single father households in the United States with a correlation coefficient (R) of 0.437 and weighted average of 2.8%. Similarly, the statistical analysis conducted on geographies consisting of 143,992,670 people shows a poor negative correlation between the proportion of Luxembourgers and percentage of single father households in the United States with a correlation coefficient (R) of -0.181 and weighted average of 2.2%, a difference of 24.1%.
Single Father Households Correlation Summary
| Measurement | Cree | Luxembourger |
| Minimum | 1.7% | 0.55% |
| Maximum | 14.8% | 5.9% |
| Range | 13.1% | 5.3% |
| Mean | 4.4% | 2.4% |
| Median | 3.4% | 2.2% |
| Interquartile 25% (IQ1) | 2.7% | 1.8% |
| Interquartile 75% (IQ3) | 5.3% | 2.8% |
| Interquartile Range (IQR) | 2.7% | 1.0% |
| Standard Deviation (Sample) | 2.7% | 0.98% |
| Standard Deviation (Population) | 2.7% | 0.97% |
Similar Demographics by Single Father Households
Demographics Similar to Cree by Single Father Households
In terms of single father households, the demographic groups most similar to Cree are Lumbee (2.8%, a difference of 0.38%), Honduran (2.8%, a difference of 0.49%), Japanese (2.8%, a difference of 0.57%), Chickasaw (2.8%, a difference of 0.59%), and Kiowa (2.8%, a difference of 0.77%).
| Demographics | Rating | Rank | Single Father Households |
| Blackfeet | 0.0 /100 | #291 | Tragic 2.7% |
| Choctaw | 0.0 /100 | #292 | Tragic 2.7% |
| Immigrants | Fiji | 0.0 /100 | #293 | Tragic 2.7% |
| Malaysians | 0.0 /100 | #294 | Tragic 2.7% |
| Chickasaw | 0.0 /100 | #295 | Tragic 2.8% |
| Japanese | 0.0 /100 | #296 | Tragic 2.8% |
| Hondurans | 0.0 /100 | #297 | Tragic 2.8% |
| Cree | 0.0 /100 | #298 | Tragic 2.8% |
| Lumbee | 0.0 /100 | #299 | Tragic 2.8% |
| Kiowa | 0.0 /100 | #300 | Tragic 2.8% |
| Immigrants | Latin America | 0.0 /100 | #301 | Tragic 2.8% |
| Spanish Americans | 0.0 /100 | #302 | Tragic 2.8% |
| Immigrants | Honduras | 0.0 /100 | #303 | Tragic 2.8% |
| Mexican American Indians | 0.0 /100 | #304 | Tragic 2.8% |
| Hispanics or Latinos | 0.0 /100 | #305 | Tragic 2.8% |
Demographics Similar to Luxembourgers by Single Father Households
In terms of single father households, the demographic groups most similar to Luxembourgers are Laotian (2.2%, a difference of 0.040%), Immigrants from Nepal (2.2%, a difference of 0.060%), Brazilian (2.2%, a difference of 0.13%), British (2.2%, a difference of 0.13%), and Slovak (2.2%, a difference of 0.40%).
| Demographics | Rating | Rank | Single Father Households |
| Syrians | 94.8 /100 | #135 | Exceptional 2.2% |
| Chileans | 94.5 /100 | #136 | Exceptional 2.2% |
| Austrians | 94.2 /100 | #137 | Exceptional 2.2% |
| West Indians | 94.1 /100 | #138 | Exceptional 2.2% |
| Brazilians | 92.8 /100 | #139 | Exceptional 2.2% |
| British | 92.8 /100 | #140 | Exceptional 2.2% |
| Laotians | 92.5 /100 | #141 | Exceptional 2.2% |
| Luxembourgers | 92.3 /100 | #142 | Exceptional 2.2% |
| Immigrants | Nepal | 92.1 /100 | #143 | Exceptional 2.2% |
| Slovaks | 90.7 /100 | #144 | Exceptional 2.2% |
| Immigrants | Zimbabwe | 90.2 /100 | #145 | Exceptional 2.2% |
| Northern Europeans | 89.8 /100 | #146 | Excellent 2.2% |
| Slavs | 88.9 /100 | #147 | Excellent 2.2% |
| South American Indians | 88.5 /100 | #148 | Excellent 2.3% |
| Senegalese | 88.4 /100 | #149 | Excellent 2.3% |