Immigrants from Iraq vs Luxembourger Single Father Households
COMPARE
Immigrants from Iraq
Luxembourger
Single Father Households
Single Father Households Comparison
Immigrants from Iraq
Luxembourgers
2.2%
SINGLE FATHER HOUSEHOLDS
97.6/ 100
METRIC RATING
122nd/ 347
METRIC RANK
2.2%
SINGLE FATHER HOUSEHOLDS
92.3/ 100
METRIC RATING
142nd/ 347
METRIC RANK
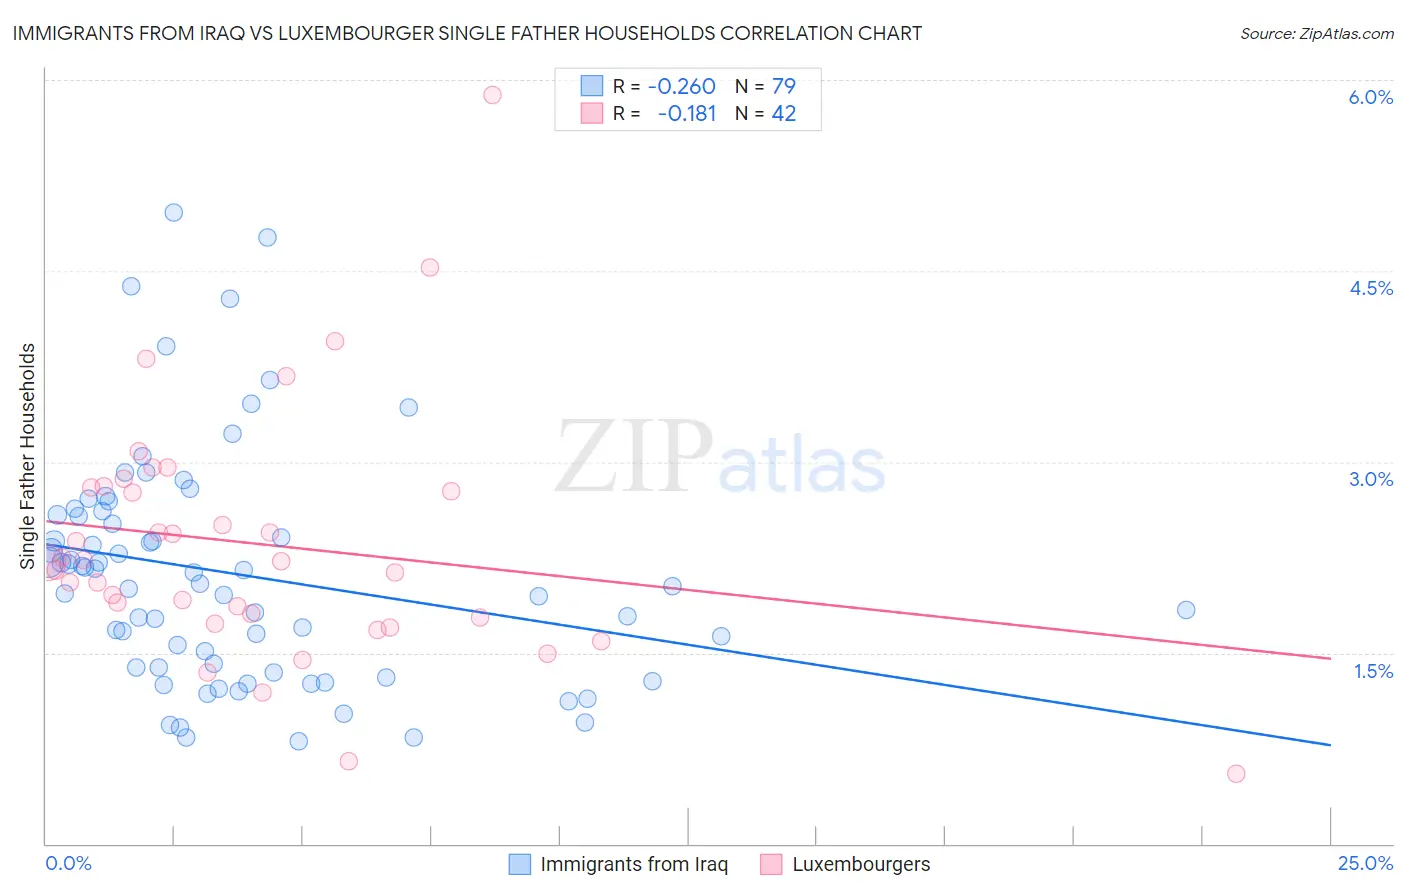
Immigrants from Iraq vs Luxembourger Single Father Households Correlation Chart
The statistical analysis conducted on geographies consisting of 194,132,696 people shows a weak negative correlation between the proportion of Immigrants from Iraq and percentage of single father households in the United States with a correlation coefficient (R) of -0.260 and weighted average of 2.2%. Similarly, the statistical analysis conducted on geographies consisting of 143,992,670 people shows a poor negative correlation between the proportion of Luxembourgers and percentage of single father households in the United States with a correlation coefficient (R) of -0.181 and weighted average of 2.2%, a difference of 2.4%.
Single Father Households Correlation Summary
| Measurement | Immigrants from Iraq | Luxembourger |
| Minimum | 0.80% | 0.55% |
| Maximum | 5.0% | 5.9% |
| Range | 4.2% | 5.3% |
| Mean | 2.1% | 2.4% |
| Median | 2.0% | 2.2% |
| Interquartile 25% (IQ1) | 1.4% | 1.8% |
| Interquartile 75% (IQ3) | 2.6% | 2.8% |
| Interquartile Range (IQR) | 1.2% | 1.0% |
| Standard Deviation (Sample) | 0.91% | 0.98% |
| Standard Deviation (Population) | 0.90% | 0.97% |
Demographics Similar to Immigrants from Iraq and Luxembourgers by Single Father Households
In terms of single father households, the demographic groups most similar to Immigrants from Iraq are Immigrants from Yemen (2.2%, a difference of 0.15%), British West Indian (2.2%, a difference of 0.17%), Immigrants from Indonesia (2.2%, a difference of 0.22%), Moroccan (2.2%, a difference of 0.53%), and Jordanian (2.2%, a difference of 0.53%). Similarly, the demographic groups most similar to Luxembourgers are Laotian (2.2%, a difference of 0.040%), Brazilian (2.2%, a difference of 0.13%), British (2.2%, a difference of 0.13%), West Indian (2.2%, a difference of 0.55%), and Austrian (2.2%, a difference of 0.58%).
| Demographics | Rating | Rank | Single Father Households |
| Immigrants | Iraq | 97.6 /100 | #122 | Exceptional 2.2% |
| Immigrants | Yemen | 97.5 /100 | #123 | Exceptional 2.2% |
| British West Indians | 97.4 /100 | #124 | Exceptional 2.2% |
| Immigrants | Indonesia | 97.4 /100 | #125 | Exceptional 2.2% |
| Moroccans | 96.9 /100 | #126 | Exceptional 2.2% |
| Jordanians | 96.9 /100 | #127 | Exceptional 2.2% |
| Immigrants | England | 96.8 /100 | #128 | Exceptional 2.2% |
| Serbians | 96.8 /100 | #129 | Exceptional 2.2% |
| Immigrants | Chile | 96.7 /100 | #130 | Exceptional 2.2% |
| Immigrants | Jordan | 96.6 /100 | #131 | Exceptional 2.2% |
| Poles | 96.5 /100 | #132 | Exceptional 2.2% |
| Taiwanese | 96.3 /100 | #133 | Exceptional 2.2% |
| Zimbabweans | 95.1 /100 | #134 | Exceptional 2.2% |
| Syrians | 94.8 /100 | #135 | Exceptional 2.2% |
| Chileans | 94.5 /100 | #136 | Exceptional 2.2% |
| Austrians | 94.2 /100 | #137 | Exceptional 2.2% |
| West Indians | 94.1 /100 | #138 | Exceptional 2.2% |
| Brazilians | 92.8 /100 | #139 | Exceptional 2.2% |
| British | 92.8 /100 | #140 | Exceptional 2.2% |
| Laotians | 92.5 /100 | #141 | Exceptional 2.2% |
| Luxembourgers | 92.3 /100 | #142 | Exceptional 2.2% |