Maltese vs Immigrants from Dominican Republic Divorced or Separated
COMPARE
Maltese
Immigrants from Dominican Republic
Divorced or Separated
Divorced or Separated Comparison
Maltese
Immigrants from Dominican Republic
11.6%
DIVORCED OR SEPARATED
98.2/ 100
METRIC RATING
103rd/ 347
METRIC RANK
12.7%
DIVORCED OR SEPARATED
0.2/ 100
METRIC RATING
279th/ 347
METRIC RANK
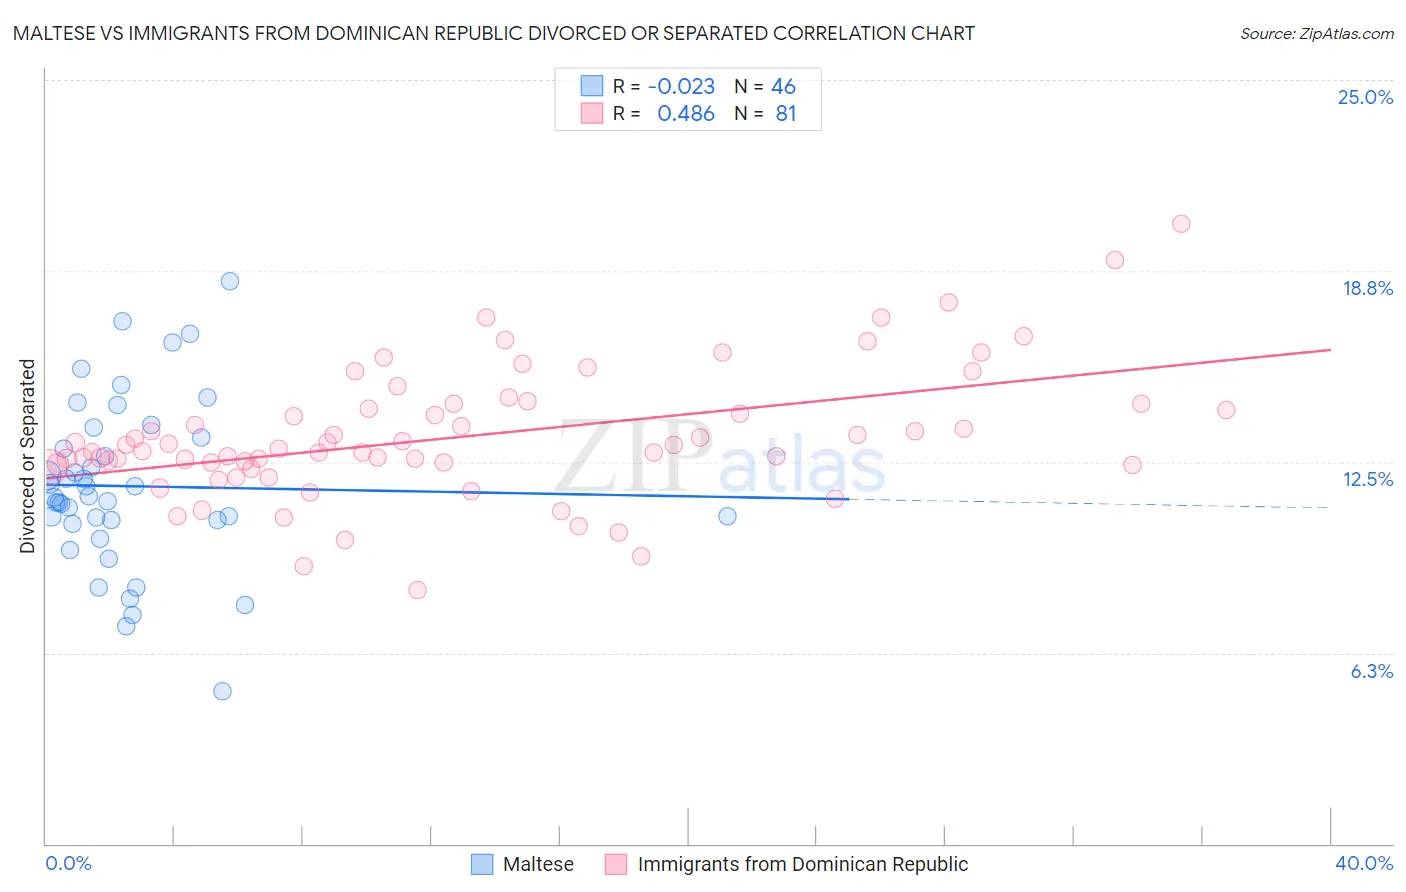
Maltese vs Immigrants from Dominican Republic Divorced or Separated Correlation Chart
The statistical analysis conducted on geographies consisting of 126,447,964 people shows no correlation between the proportion of Maltese and percentage of population currently divorced or separated in the United States with a correlation coefficient (R) of -0.023 and weighted average of 11.6%. Similarly, the statistical analysis conducted on geographies consisting of 275,019,044 people shows a moderate positive correlation between the proportion of Immigrants from Dominican Republic and percentage of population currently divorced or separated in the United States with a correlation coefficient (R) of 0.486 and weighted average of 12.7%, a difference of 9.2%.
Divorced or Separated Correlation Summary
| Measurement | Maltese | Immigrants from Dominican Republic |
| Minimum | 5.0% | 8.3% |
| Maximum | 18.4% | 20.3% |
| Range | 13.4% | 12.0% |
| Mean | 11.7% | 13.3% |
| Median | 11.4% | 12.9% |
| Interquartile 25% (IQ1) | 10.6% | 12.4% |
| Interquartile 75% (IQ3) | 13.3% | 14.3% |
| Interquartile Range (IQR) | 2.7% | 1.9% |
| Standard Deviation (Sample) | 2.8% | 2.1% |
| Standard Deviation (Population) | 2.7% | 2.1% |
Similar Demographics by Divorced or Separated
Demographics Similar to Maltese by Divorced or Separated
In terms of divorced or separated, the demographic groups most similar to Maltese are Salvadoran (11.6%, a difference of 0.020%), Immigrants from Croatia (11.6%, a difference of 0.040%), Immigrants from El Salvador (11.7%, a difference of 0.14%), Immigrants from Guyana (11.6%, a difference of 0.18%), and Immigrants from Kazakhstan (11.7%, a difference of 0.18%).
| Demographics | Rating | Rank | Divorced or Separated |
| Immigrants | Ukraine | 98.7 /100 | #96 | Exceptional 11.6% |
| Latvians | 98.7 /100 | #97 | Exceptional 11.6% |
| Immigrants | Jordan | 98.6 /100 | #98 | Exceptional 11.6% |
| Immigrants | Sweden | 98.6 /100 | #99 | Exceptional 11.6% |
| Immigrants | Northern Europe | 98.6 /100 | #100 | Exceptional 11.6% |
| Immigrants | Guyana | 98.5 /100 | #101 | Exceptional 11.6% |
| Immigrants | Croatia | 98.3 /100 | #102 | Exceptional 11.6% |
| Maltese | 98.2 /100 | #103 | Exceptional 11.6% |
| Salvadorans | 98.2 /100 | #104 | Exceptional 11.6% |
| Immigrants | El Salvador | 97.9 /100 | #105 | Exceptional 11.7% |
| Immigrants | Kazakhstan | 97.8 /100 | #106 | Exceptional 11.7% |
| Native Hawaiians | 97.2 /100 | #107 | Exceptional 11.7% |
| Greeks | 96.9 /100 | #108 | Exceptional 11.7% |
| Immigrants | South Africa | 96.9 /100 | #109 | Exceptional 11.7% |
| Immigrants | Czechoslovakia | 96.9 /100 | #110 | Exceptional 11.7% |
Demographics Similar to Immigrants from Dominican Republic by Divorced or Separated
In terms of divorced or separated, the demographic groups most similar to Immigrants from Dominican Republic are Lumbee (12.7%, a difference of 0.010%), Immigrants from Zaire (12.7%, a difference of 0.070%), Pueblo (12.7%, a difference of 0.11%), Dominican (12.7%, a difference of 0.16%), and Spaniard (12.7%, a difference of 0.21%).
| Demographics | Rating | Rank | Divorced or Separated |
| Immigrants | Middle Africa | 0.3 /100 | #272 | Tragic 12.7% |
| Immigrants | Micronesia | 0.3 /100 | #273 | Tragic 12.7% |
| Bermudans | 0.3 /100 | #274 | Tragic 12.7% |
| Central American Indians | 0.3 /100 | #275 | Tragic 12.7% |
| Spaniards | 0.2 /100 | #276 | Tragic 12.7% |
| Dominicans | 0.2 /100 | #277 | Tragic 12.7% |
| Lumbee | 0.2 /100 | #278 | Tragic 12.7% |
| Immigrants | Dominican Republic | 0.2 /100 | #279 | Tragic 12.7% |
| Immigrants | Zaire | 0.2 /100 | #280 | Tragic 12.7% |
| Pueblo | 0.2 /100 | #281 | Tragic 12.7% |
| Sub-Saharan Africans | 0.1 /100 | #282 | Tragic 12.7% |
| Delaware | 0.1 /100 | #283 | Tragic 12.7% |
| Immigrants | Nonimmigrants | 0.1 /100 | #284 | Tragic 12.8% |
| French | 0.1 /100 | #285 | Tragic 12.8% |
| Spanish | 0.1 /100 | #286 | Tragic 12.8% |