Luxembourger vs Tsimshian Single Mother Households
COMPARE
Luxembourger
Tsimshian
Single Mother Households
Single Mother Households Comparison
Luxembourgers
Tsimshian
5.6%
SINGLE MOTHER HOUSEHOLDS
98.7/ 100
METRIC RATING
59th/ 347
METRIC RANK
6.0%
SINGLE MOTHER HOUSEHOLDS
85.2/ 100
METRIC RATING
141st/ 347
METRIC RANK
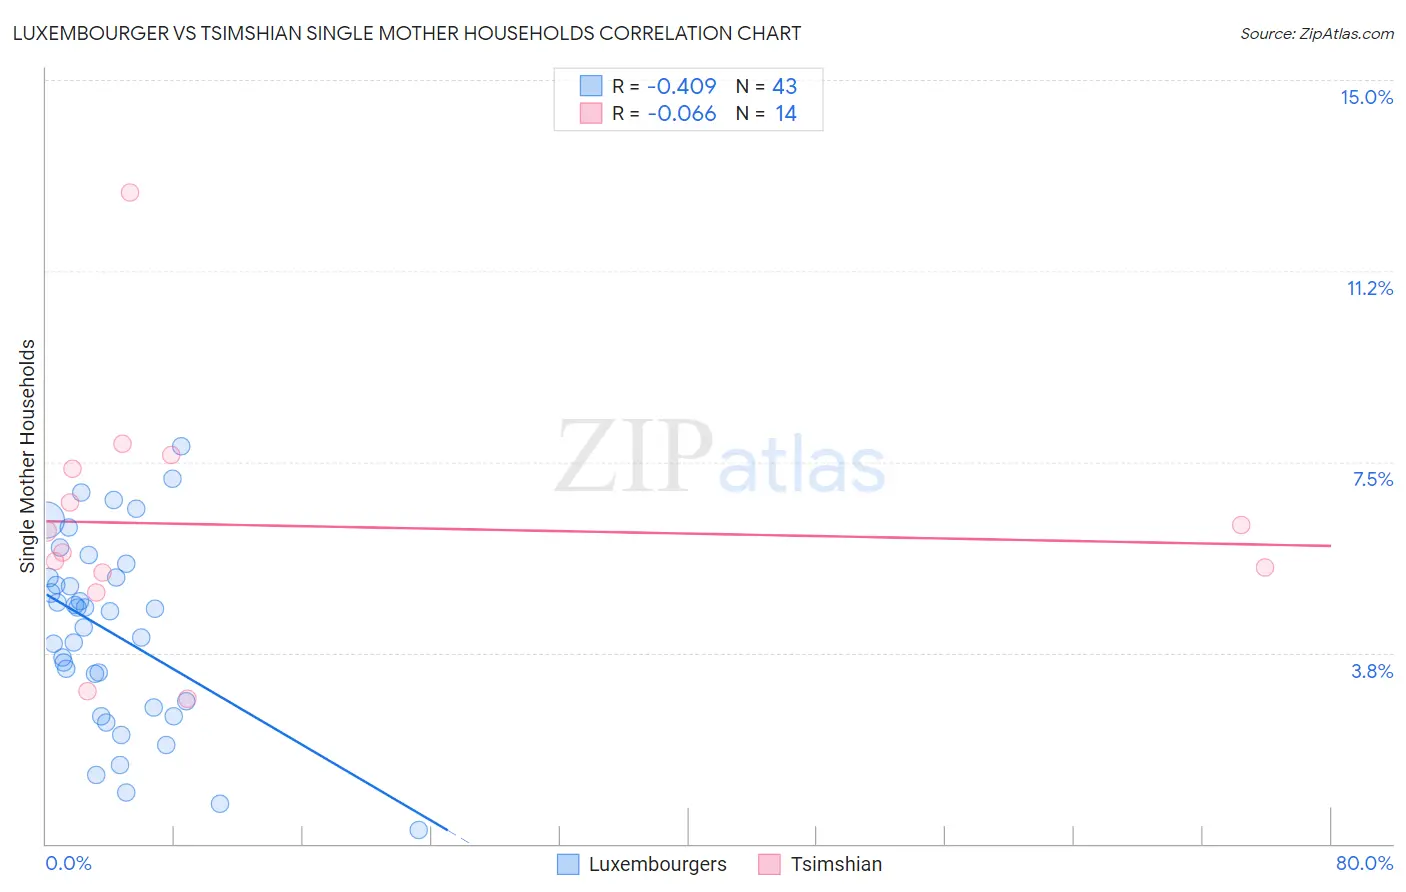
Luxembourger vs Tsimshian Single Mother Households Correlation Chart
The statistical analysis conducted on geographies consisting of 144,304,959 people shows a moderate negative correlation between the proportion of Luxembourgers and percentage of single mother households in the United States with a correlation coefficient (R) of -0.409 and weighted average of 5.6%. Similarly, the statistical analysis conducted on geographies consisting of 15,617,285 people shows a slight negative correlation between the proportion of Tsimshian and percentage of single mother households in the United States with a correlation coefficient (R) of -0.066 and weighted average of 6.0%, a difference of 8.1%.
Single Mother Households Correlation Summary
| Measurement | Luxembourger | Tsimshian |
| Minimum | 0.28% | 2.8% |
| Maximum | 7.8% | 12.8% |
| Range | 7.5% | 10.0% |
| Mean | 4.1% | 6.3% |
| Median | 4.6% | 5.9% |
| Interquartile 25% (IQ1) | 2.7% | 5.3% |
| Interquartile 75% (IQ3) | 5.2% | 7.4% |
| Interquartile Range (IQR) | 2.5% | 2.1% |
| Standard Deviation (Sample) | 1.8% | 2.4% |
| Standard Deviation (Population) | 1.8% | 2.3% |
Similar Demographics by Single Mother Households
Demographics Similar to Luxembourgers by Single Mother Households
In terms of single mother households, the demographic groups most similar to Luxembourgers are Immigrants from Norway (5.6%, a difference of 0.15%), Australian (5.6%, a difference of 0.22%), Polish (5.6%, a difference of 0.23%), Immigrants from North Macedonia (5.6%, a difference of 0.29%), and Immigrants from France (5.6%, a difference of 0.33%).
| Demographics | Rating | Rank | Single Mother Households |
| Swedes | 99.1 /100 | #52 | Exceptional 5.5% |
| Immigrants | Russia | 99.1 /100 | #53 | Exceptional 5.5% |
| Immigrants | Lebanon | 99.1 /100 | #54 | Exceptional 5.5% |
| Immigrants | Denmark | 99.1 /100 | #55 | Exceptional 5.5% |
| Immigrants | Romania | 99.0 /100 | #56 | Exceptional 5.5% |
| Immigrants | Europe | 99.0 /100 | #57 | Exceptional 5.5% |
| Danes | 98.9 /100 | #58 | Exceptional 5.5% |
| Luxembourgers | 98.7 /100 | #59 | Exceptional 5.6% |
| Immigrants | Norway | 98.7 /100 | #60 | Exceptional 5.6% |
| Australians | 98.7 /100 | #61 | Exceptional 5.6% |
| Poles | 98.6 /100 | #62 | Exceptional 5.6% |
| Immigrants | North Macedonia | 98.6 /100 | #63 | Exceptional 5.6% |
| Immigrants | France | 98.6 /100 | #64 | Exceptional 5.6% |
| Greeks | 98.6 /100 | #65 | Exceptional 5.6% |
| Immigrants | Canada | 98.5 /100 | #66 | Exceptional 5.6% |
Demographics Similar to Tsimshian by Single Mother Households
In terms of single mother households, the demographic groups most similar to Tsimshian are Immigrants from Egypt (6.0%, a difference of 0.050%), Immigrants from Iraq (6.0%, a difference of 0.090%), French (6.0%, a difference of 0.10%), Syrian (6.0%, a difference of 0.17%), and Korean (6.0%, a difference of 0.19%).
| Demographics | Rating | Rank | Single Mother Households |
| Canadians | 90.5 /100 | #134 | Exceptional 5.9% |
| Immigrants | Saudi Arabia | 90.2 /100 | #135 | Exceptional 5.9% |
| Jordanians | 88.9 /100 | #136 | Excellent 6.0% |
| Immigrants | Pakistan | 88.4 /100 | #137 | Excellent 6.0% |
| Icelanders | 86.9 /100 | #138 | Excellent 6.0% |
| Syrians | 86.0 /100 | #139 | Excellent 6.0% |
| French | 85.7 /100 | #140 | Excellent 6.0% |
| Tsimshian | 85.2 /100 | #141 | Excellent 6.0% |
| Immigrants | Egypt | 85.0 /100 | #142 | Excellent 6.0% |
| Immigrants | Iraq | 84.8 /100 | #143 | Excellent 6.0% |
| Koreans | 84.4 /100 | #144 | Excellent 6.0% |
| Arabs | 84.0 /100 | #145 | Excellent 6.0% |
| French Canadians | 82.6 /100 | #146 | Excellent 6.0% |
| Immigrants | Jordan | 82.3 /100 | #147 | Excellent 6.0% |
| Scotch-Irish | 82.0 /100 | #148 | Excellent 6.0% |