Luxembourger vs Peruvian Single Mother Households
COMPARE
Luxembourger
Peruvian
Single Mother Households
Single Mother Households Comparison
Luxembourgers
Peruvians
5.6%
SINGLE MOTHER HOUSEHOLDS
98.7/ 100
METRIC RATING
59th/ 347
METRIC RANK
6.5%
SINGLE MOTHER HOUSEHOLDS
21.6/ 100
METRIC RATING
190th/ 347
METRIC RANK
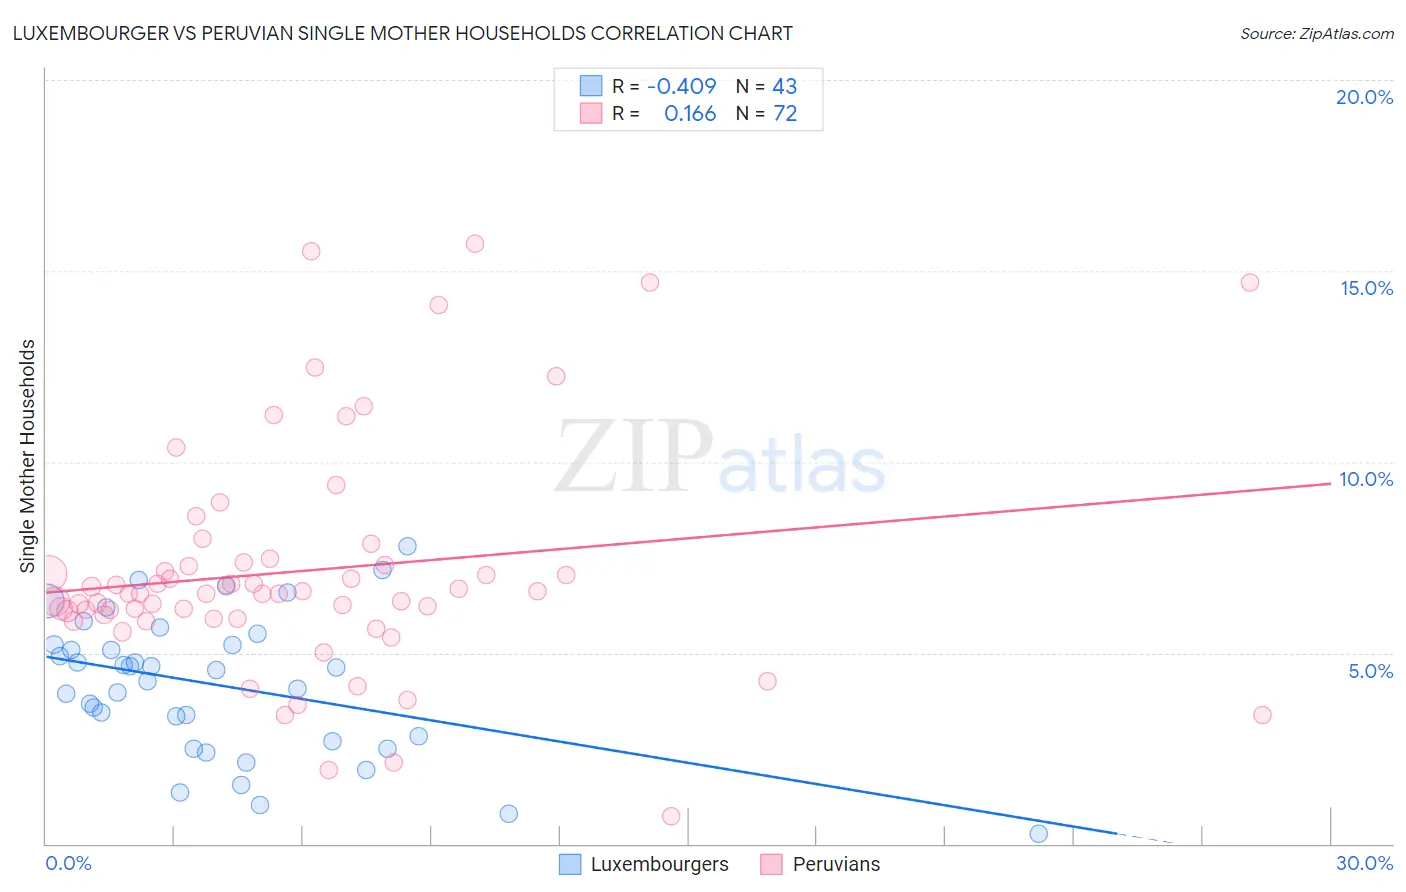
Luxembourger vs Peruvian Single Mother Households Correlation Chart
The statistical analysis conducted on geographies consisting of 144,304,959 people shows a moderate negative correlation between the proportion of Luxembourgers and percentage of single mother households in the United States with a correlation coefficient (R) of -0.409 and weighted average of 5.6%. Similarly, the statistical analysis conducted on geographies consisting of 362,313,446 people shows a poor positive correlation between the proportion of Peruvians and percentage of single mother households in the United States with a correlation coefficient (R) of 0.166 and weighted average of 6.5%, a difference of 17.5%.
Single Mother Households Correlation Summary
| Measurement | Luxembourger | Peruvian |
| Minimum | 0.28% | 0.73% |
| Maximum | 7.8% | 15.7% |
| Range | 7.5% | 15.0% |
| Mean | 4.1% | 7.1% |
| Median | 4.6% | 6.6% |
| Interquartile 25% (IQ1) | 2.7% | 5.9% |
| Interquartile 75% (IQ3) | 5.2% | 7.3% |
| Interquartile Range (IQR) | 2.5% | 1.4% |
| Standard Deviation (Sample) | 1.8% | 3.0% |
| Standard Deviation (Population) | 1.8% | 3.0% |
Similar Demographics by Single Mother Households
Demographics Similar to Luxembourgers by Single Mother Households
In terms of single mother households, the demographic groups most similar to Luxembourgers are Immigrants from Norway (5.6%, a difference of 0.15%), Australian (5.6%, a difference of 0.22%), Polish (5.6%, a difference of 0.23%), Immigrants from North Macedonia (5.6%, a difference of 0.29%), and Immigrants from France (5.6%, a difference of 0.33%).
| Demographics | Rating | Rank | Single Mother Households |
| Swedes | 99.1 /100 | #52 | Exceptional 5.5% |
| Immigrants | Russia | 99.1 /100 | #53 | Exceptional 5.5% |
| Immigrants | Lebanon | 99.1 /100 | #54 | Exceptional 5.5% |
| Immigrants | Denmark | 99.1 /100 | #55 | Exceptional 5.5% |
| Immigrants | Romania | 99.0 /100 | #56 | Exceptional 5.5% |
| Immigrants | Europe | 99.0 /100 | #57 | Exceptional 5.5% |
| Danes | 98.9 /100 | #58 | Exceptional 5.5% |
| Luxembourgers | 98.7 /100 | #59 | Exceptional 5.6% |
| Immigrants | Norway | 98.7 /100 | #60 | Exceptional 5.6% |
| Australians | 98.7 /100 | #61 | Exceptional 5.6% |
| Poles | 98.6 /100 | #62 | Exceptional 5.6% |
| Immigrants | North Macedonia | 98.6 /100 | #63 | Exceptional 5.6% |
| Immigrants | France | 98.6 /100 | #64 | Exceptional 5.6% |
| Greeks | 98.6 /100 | #65 | Exceptional 5.6% |
| Immigrants | Canada | 98.5 /100 | #66 | Exceptional 5.6% |
Demographics Similar to Peruvians by Single Mother Households
In terms of single mother households, the demographic groups most similar to Peruvians are Samoan (6.5%, a difference of 0.060%), Delaware (6.5%, a difference of 0.26%), Ottawa (6.5%, a difference of 0.33%), American (6.6%, a difference of 0.43%), and Immigrants from Afghanistan (6.5%, a difference of 0.46%).
| Demographics | Rating | Rank | Single Mother Households |
| Spaniards | 27.8 /100 | #183 | Fair 6.5% |
| Ethiopians | 26.0 /100 | #184 | Fair 6.5% |
| Ugandans | 25.6 /100 | #185 | Fair 6.5% |
| Costa Ricans | 24.8 /100 | #186 | Fair 6.5% |
| Immigrants | Afghanistan | 24.7 /100 | #187 | Fair 6.5% |
| Ottawa | 23.8 /100 | #188 | Fair 6.5% |
| Delaware | 23.3 /100 | #189 | Fair 6.5% |
| Peruvians | 21.6 /100 | #190 | Fair 6.5% |
| Samoans | 21.2 /100 | #191 | Fair 6.5% |
| Americans | 19.0 /100 | #192 | Poor 6.6% |
| Colombians | 18.3 /100 | #193 | Poor 6.6% |
| Immigrants | Uganda | 18.3 /100 | #194 | Poor 6.6% |
| South Americans | 18.0 /100 | #195 | Poor 6.6% |
| Uruguayans | 18.0 /100 | #196 | Poor 6.6% |
| Moroccans | 17.4 /100 | #197 | Poor 6.6% |