Subsaharan African vs Immigrants from Netherlands Family Households with Children
COMPARE
Subsaharan African
Immigrants from Netherlands
Family Households with Children
Family Households with Children Comparison
Sub-Saharan Africans
Immigrants from Netherlands
27.6%
FAMILY HOUSEHOLDS WITH CHILDREN
67.5/ 100
METRIC RATING
160th/ 347
METRIC RANK
26.9%
FAMILY HOUSEHOLDS WITH CHILDREN
3.5/ 100
METRIC RATING
237th/ 347
METRIC RANK
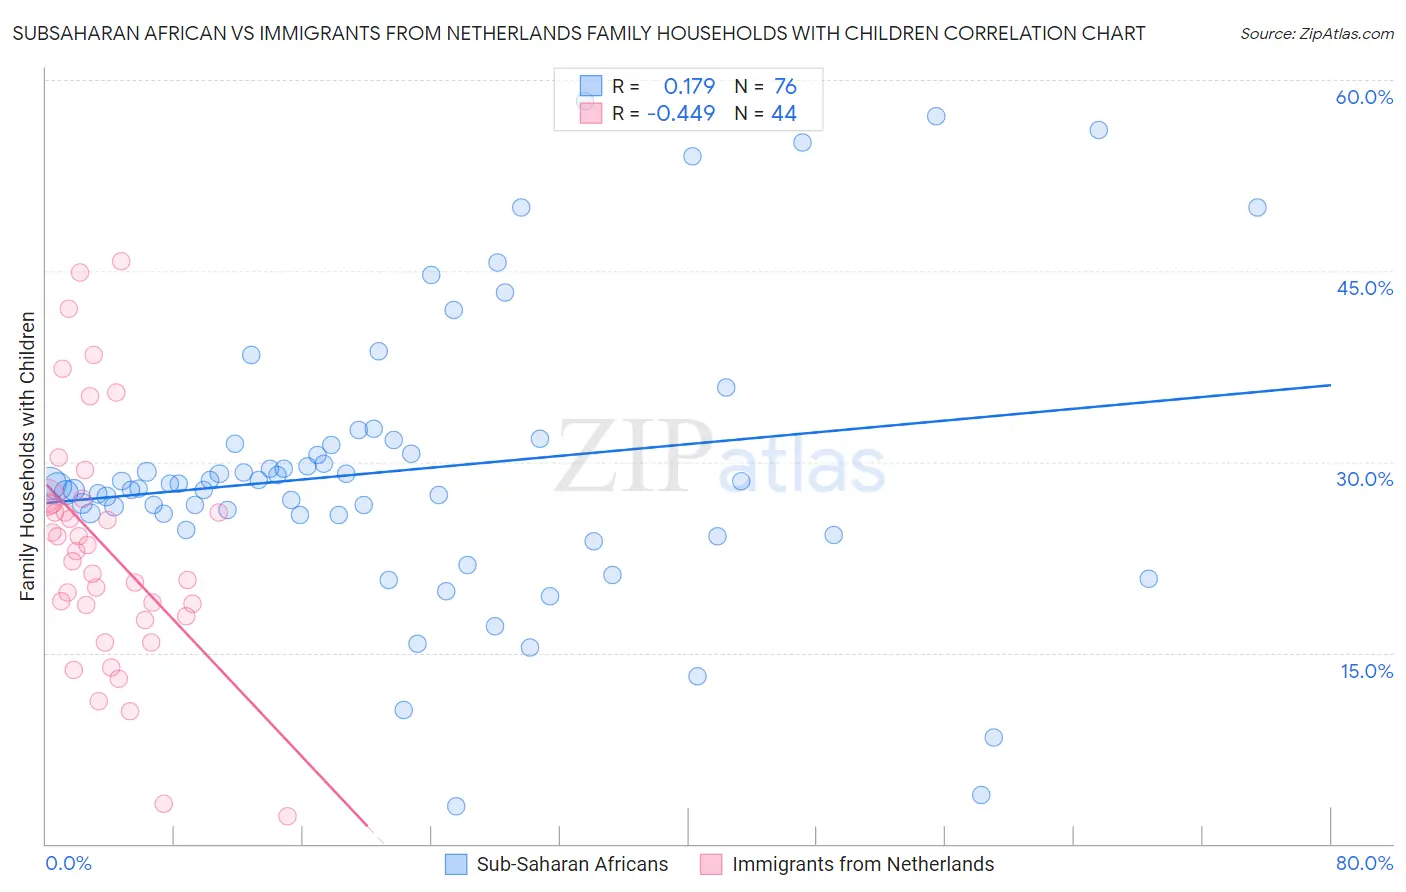
Subsaharan African vs Immigrants from Netherlands Family Households with Children Correlation Chart
The statistical analysis conducted on geographies consisting of 507,337,784 people shows a poor positive correlation between the proportion of Sub-Saharan Africans and percentage of family households with children in the United States with a correlation coefficient (R) of 0.179 and weighted average of 27.6%. Similarly, the statistical analysis conducted on geographies consisting of 237,672,305 people shows a moderate negative correlation between the proportion of Immigrants from Netherlands and percentage of family households with children in the United States with a correlation coefficient (R) of -0.449 and weighted average of 26.9%, a difference of 2.3%.
Family Households with Children Correlation Summary
| Measurement | Subsaharan African | Immigrants from Netherlands |
| Minimum | 3.0% | 2.1% |
| Maximum | 58.3% | 45.8% |
| Range | 55.4% | 43.7% |
| Mean | 29.4% | 23.4% |
| Median | 28.2% | 23.2% |
| Interquartile 25% (IQ1) | 25.8% | 18.3% |
| Interquartile 75% (IQ3) | 31.4% | 27.0% |
| Interquartile Range (IQR) | 5.6% | 8.7% |
| Standard Deviation (Sample) | 11.1% | 9.6% |
| Standard Deviation (Population) | 11.0% | 9.5% |
Similar Demographics by Family Households with Children
Demographics Similar to Sub-Saharan Africans by Family Households with Children
In terms of family households with children, the demographic groups most similar to Sub-Saharan Africans are Alaskan Athabascan (27.6%, a difference of 0.010%), Immigrants from Bangladesh (27.6%, a difference of 0.010%), Czech (27.5%, a difference of 0.050%), Immigrants from Hong Kong (27.5%, a difference of 0.060%), and Romanian (27.6%, a difference of 0.080%).
| Demographics | Rating | Rank | Family Households with Children |
| Immigrants | Cabo Verde | 75.6 /100 | #153 | Good 27.6% |
| Icelanders | 75.3 /100 | #154 | Good 27.6% |
| Comanche | 74.8 /100 | #155 | Good 27.6% |
| Hungarians | 74.6 /100 | #156 | Good 27.6% |
| Indians (Asian) | 71.6 /100 | #157 | Good 27.6% |
| Romanians | 70.8 /100 | #158 | Good 27.6% |
| Mongolians | 70.7 /100 | #159 | Good 27.6% |
| Sub-Saharan Africans | 67.5 /100 | #160 | Good 27.6% |
| Alaskan Athabascans | 67.1 /100 | #161 | Good 27.6% |
| Immigrants | Bangladesh | 67.0 /100 | #162 | Good 27.6% |
| Czechs | 65.3 /100 | #163 | Good 27.5% |
| Immigrants | Hong Kong | 64.9 /100 | #164 | Good 27.5% |
| Immigrants | South Africa | 61.3 /100 | #165 | Good 27.5% |
| Immigrants | Nonimmigrants | 61.2 /100 | #166 | Good 27.5% |
| Dominicans | 61.1 /100 | #167 | Good 27.5% |
Demographics Similar to Immigrants from Netherlands by Family Households with Children
In terms of family households with children, the demographic groups most similar to Immigrants from Netherlands are Moroccan (26.9%, a difference of 0.010%), Cape Verdean (26.9%, a difference of 0.020%), Immigrants from Southern Europe (26.9%, a difference of 0.020%), Immigrants from Bulgaria (26.9%, a difference of 0.030%), and Navajo (26.9%, a difference of 0.040%).
| Demographics | Rating | Rank | Family Households with Children |
| Bulgarians | 5.8 /100 | #230 | Tragic 27.0% |
| Luxembourgers | 5.5 /100 | #231 | Tragic 27.0% |
| Yugoslavians | 5.1 /100 | #232 | Tragic 27.0% |
| Immigrants | Italy | 5.0 /100 | #233 | Tragic 27.0% |
| Immigrants | Germany | 4.4 /100 | #234 | Tragic 27.0% |
| Immigrants | Morocco | 4.2 /100 | #235 | Tragic 27.0% |
| Cape Verdeans | 3.6 /100 | #236 | Tragic 26.9% |
| Immigrants | Netherlands | 3.5 /100 | #237 | Tragic 26.9% |
| Moroccans | 3.4 /100 | #238 | Tragic 26.9% |
| Immigrants | Southern Europe | 3.4 /100 | #239 | Tragic 26.9% |
| Immigrants | Bulgaria | 3.3 /100 | #240 | Tragic 26.9% |
| Navajo | 3.2 /100 | #241 | Tragic 26.9% |
| Immigrants | England | 3.2 /100 | #242 | Tragic 26.9% |
| Immigrants | Saudi Arabia | 2.9 /100 | #243 | Tragic 26.9% |
| Ukrainians | 2.9 /100 | #244 | Tragic 26.9% |