Luxembourger vs Paraguayan Family Households with Children
COMPARE
Luxembourger
Paraguayan
Family Households with Children
Family Households with Children Comparison
Luxembourgers
Paraguayans
27.0%
FAMILY HOUSEHOLDS WITH CHILDREN
5.5/ 100
METRIC RATING
231st/ 347
METRIC RANK
27.1%
FAMILY HOUSEHOLDS WITH CHILDREN
9.4/ 100
METRIC RATING
222nd/ 347
METRIC RANK
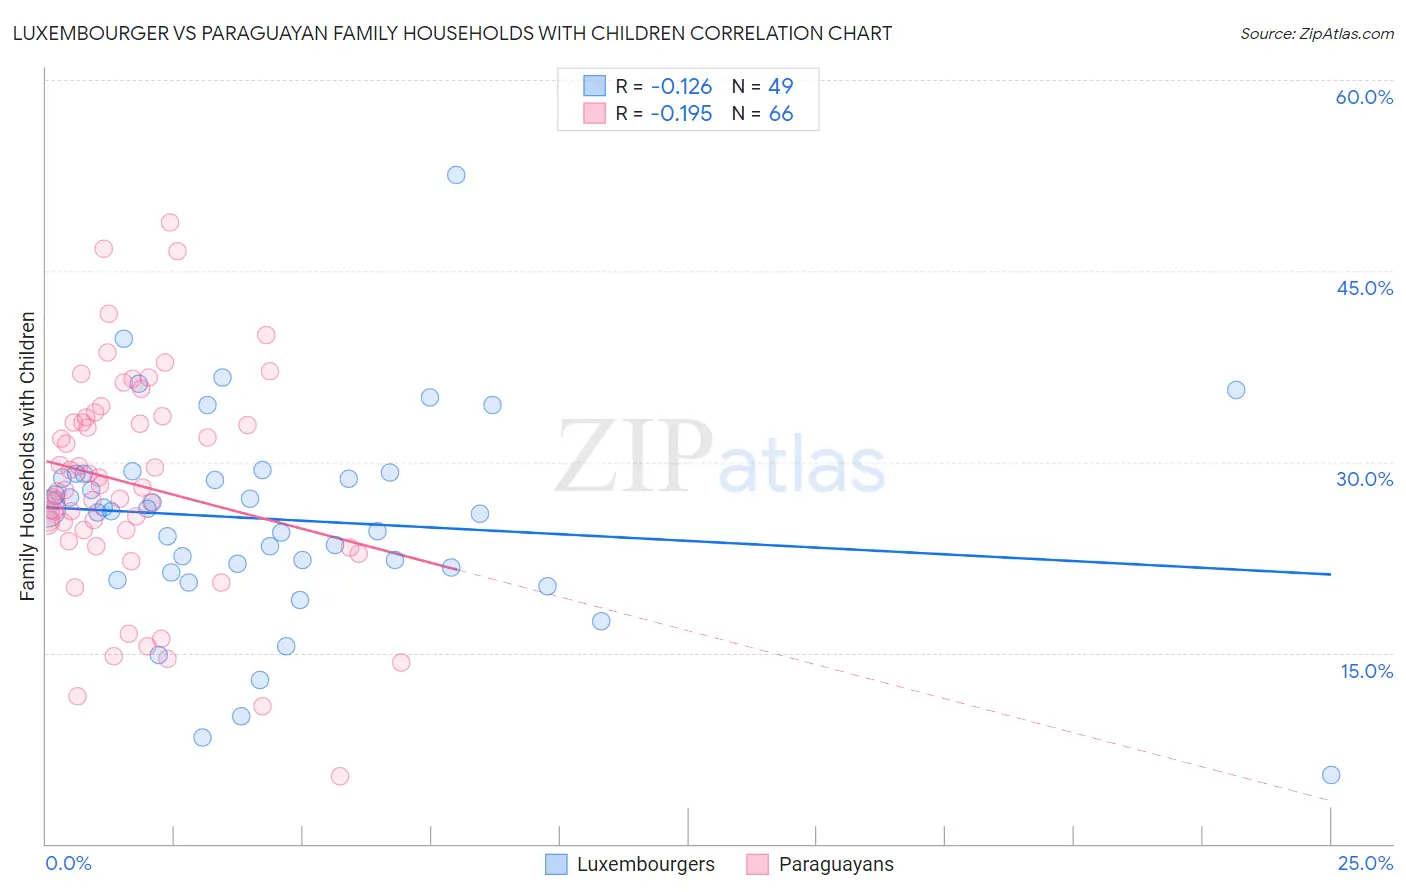
Luxembourger vs Paraguayan Family Households with Children Correlation Chart
The statistical analysis conducted on geographies consisting of 144,627,204 people shows a poor negative correlation between the proportion of Luxembourgers and percentage of family households with children in the United States with a correlation coefficient (R) of -0.126 and weighted average of 27.0%. Similarly, the statistical analysis conducted on geographies consisting of 95,067,312 people shows a poor negative correlation between the proportion of Paraguayans and percentage of family households with children in the United States with a correlation coefficient (R) of -0.195 and weighted average of 27.1%, a difference of 0.32%.

Family Households with Children Correlation Summary
| Measurement | Luxembourger | Paraguayan |
| Minimum | 5.4% | 5.3% |
| Maximum | 52.5% | 48.8% |
| Range | 47.1% | 43.5% |
| Mean | 25.5% | 28.3% |
| Median | 26.1% | 27.9% |
| Interquartile 25% (IQ1) | 21.5% | 24.6% |
| Interquartile 75% (IQ3) | 29.1% | 33.5% |
| Interquartile Range (IQR) | 7.6% | 8.9% |
| Standard Deviation (Sample) | 8.2% | 8.6% |
| Standard Deviation (Population) | 8.1% | 8.5% |
Demographics Similar to Luxembourgers and Paraguayans by Family Households with Children
In terms of family households with children, the demographic groups most similar to Luxembourgers are Bulgarian (27.0%, a difference of 0.030%), Yugoslavian (27.0%, a difference of 0.050%), Immigrants from Italy (27.0%, a difference of 0.050%), Immigrants from Caribbean (27.0%, a difference of 0.080%), and Scottish (27.0%, a difference of 0.10%). Similarly, the demographic groups most similar to Paraguayans are New Zealander (27.1%, a difference of 0.010%), Pima (27.1%, a difference of 0.010%), Austrian (27.1%, a difference of 0.030%), German (27.1%, a difference of 0.050%), and Immigrants from Japan (27.1%, a difference of 0.080%).
| Demographics | Rating | Rank | Family Households with Children |
| Cubans | 12.2 /100 | #216 | Poor 27.1% |
| U.S. Virgin Islanders | 12.1 /100 | #217 | Poor 27.1% |
| Greeks | 11.4 /100 | #218 | Poor 27.1% |
| Immigrants | Japan | 10.7 /100 | #219 | Poor 27.1% |
| Austrians | 9.9 /100 | #220 | Tragic 27.1% |
| New Zealanders | 9.6 /100 | #221 | Tragic 27.1% |
| Paraguayans | 9.4 /100 | #222 | Tragic 27.1% |
| Pima | 9.2 /100 | #223 | Tragic 27.1% |
| Germans | 8.7 /100 | #224 | Tragic 27.1% |
| Canadians | 7.5 /100 | #225 | Tragic 27.1% |
| Czechoslovakians | 6.6 /100 | #226 | Tragic 27.0% |
| Tsimshian | 6.6 /100 | #227 | Tragic 27.0% |
| Scottish | 6.5 /100 | #228 | Tragic 27.0% |
| Immigrants | Caribbean | 6.3 /100 | #229 | Tragic 27.0% |
| Bulgarians | 5.8 /100 | #230 | Tragic 27.0% |
| Luxembourgers | 5.5 /100 | #231 | Tragic 27.0% |
| Yugoslavians | 5.1 /100 | #232 | Tragic 27.0% |
| Immigrants | Italy | 5.0 /100 | #233 | Tragic 27.0% |
| Immigrants | Germany | 4.4 /100 | #234 | Tragic 27.0% |
| Immigrants | Morocco | 4.2 /100 | #235 | Tragic 27.0% |
| Cape Verdeans | 3.6 /100 | #236 | Tragic 26.9% |