Lithuanian vs Zimbabwean Single Father Households
COMPARE
Lithuanian
Zimbabwean
Single Father Households
Single Father Households Comparison
Lithuanians
Zimbabweans
2.1%
SINGLE FATHER HOUSEHOLDS
99.5/ 100
METRIC RATING
87th/ 347
METRIC RANK
2.2%
SINGLE FATHER HOUSEHOLDS
95.1/ 100
METRIC RATING
134th/ 347
METRIC RANK
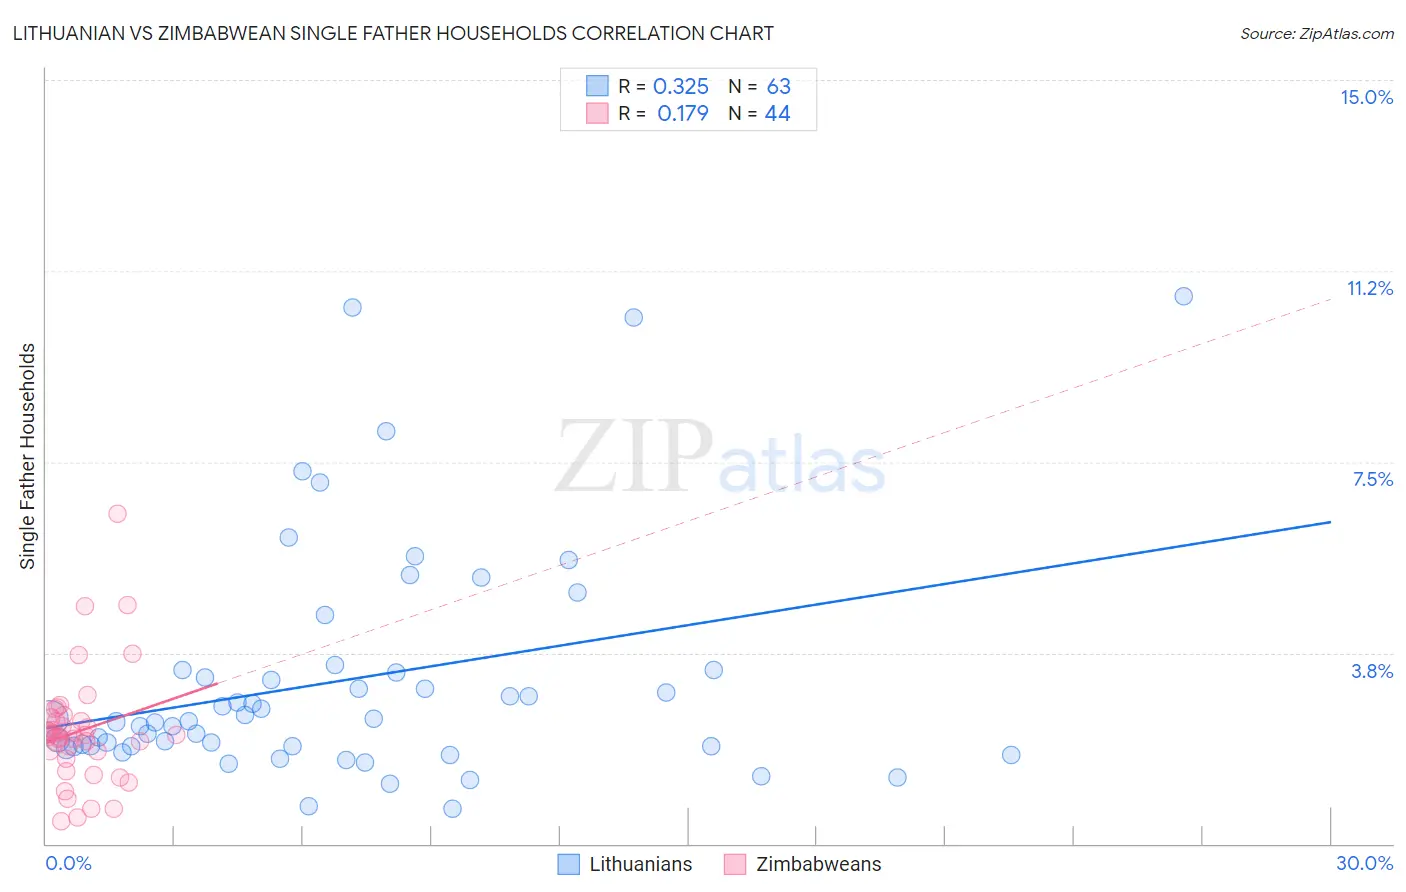
Lithuanian vs Zimbabwean Single Father Households Correlation Chart
The statistical analysis conducted on geographies consisting of 416,616,302 people shows a mild positive correlation between the proportion of Lithuanians and percentage of single father households in the United States with a correlation coefficient (R) of 0.325 and weighted average of 2.1%. Similarly, the statistical analysis conducted on geographies consisting of 69,107,979 people shows a poor positive correlation between the proportion of Zimbabweans and percentage of single father households in the United States with a correlation coefficient (R) of 0.179 and weighted average of 2.2%, a difference of 4.7%.
Single Father Households Correlation Summary
| Measurement | Lithuanian | Zimbabwean |
| Minimum | 0.69% | 0.45% |
| Maximum | 10.7% | 6.5% |
| Range | 10.0% | 6.0% |
| Mean | 3.2% | 2.2% |
| Median | 2.4% | 2.1% |
| Interquartile 25% (IQ1) | 1.9% | 1.7% |
| Interquartile 75% (IQ3) | 3.4% | 2.4% |
| Interquartile Range (IQR) | 1.5% | 0.70% |
| Standard Deviation (Sample) | 2.3% | 1.1% |
| Standard Deviation (Population) | 2.3% | 1.1% |
Similar Demographics by Single Father Households
Demographics Similar to Lithuanians by Single Father Households
In terms of single father households, the demographic groups most similar to Lithuanians are Bhutanese (2.1%, a difference of 0.13%), Immigrants from Armenia (2.1%, a difference of 0.18%), Immigrants from Pakistan (2.1%, a difference of 0.19%), Immigrants from Guyana (2.1%, a difference of 0.43%), and Asian (2.1%, a difference of 0.51%).
| Demographics | Rating | Rank | Single Father Households |
| Immigrants | South Africa | 99.7 /100 | #80 | Exceptional 2.1% |
| Armenians | 99.7 /100 | #81 | Exceptional 2.1% |
| New Zealanders | 99.7 /100 | #82 | Exceptional 2.1% |
| Greeks | 99.7 /100 | #83 | Exceptional 2.1% |
| Carpatho Rusyns | 99.6 /100 | #84 | Exceptional 2.1% |
| Immigrants | Hungary | 99.6 /100 | #85 | Exceptional 2.1% |
| Asians | 99.6 /100 | #86 | Exceptional 2.1% |
| Lithuanians | 99.5 /100 | #87 | Exceptional 2.1% |
| Bhutanese | 99.5 /100 | #88 | Exceptional 2.1% |
| Immigrants | Armenia | 99.5 /100 | #89 | Exceptional 2.1% |
| Immigrants | Pakistan | 99.5 /100 | #90 | Exceptional 2.1% |
| Immigrants | Guyana | 99.4 /100 | #91 | Exceptional 2.1% |
| Romanians | 99.4 /100 | #92 | Exceptional 2.1% |
| Croatians | 99.3 /100 | #93 | Exceptional 2.1% |
| Ukrainians | 99.3 /100 | #94 | Exceptional 2.1% |
Demographics Similar to Zimbabweans by Single Father Households
In terms of single father households, the demographic groups most similar to Zimbabweans are Syrian (2.2%, a difference of 0.11%), Chilean (2.2%, a difference of 0.23%), Austrian (2.2%, a difference of 0.34%), West Indian (2.2%, a difference of 0.37%), and Taiwanese (2.2%, a difference of 0.60%).
| Demographics | Rating | Rank | Single Father Households |
| Jordanians | 96.9 /100 | #127 | Exceptional 2.2% |
| Immigrants | England | 96.8 /100 | #128 | Exceptional 2.2% |
| Serbians | 96.8 /100 | #129 | Exceptional 2.2% |
| Immigrants | Chile | 96.7 /100 | #130 | Exceptional 2.2% |
| Immigrants | Jordan | 96.6 /100 | #131 | Exceptional 2.2% |
| Poles | 96.5 /100 | #132 | Exceptional 2.2% |
| Taiwanese | 96.3 /100 | #133 | Exceptional 2.2% |
| Zimbabweans | 95.1 /100 | #134 | Exceptional 2.2% |
| Syrians | 94.8 /100 | #135 | Exceptional 2.2% |
| Chileans | 94.5 /100 | #136 | Exceptional 2.2% |
| Austrians | 94.2 /100 | #137 | Exceptional 2.2% |
| West Indians | 94.1 /100 | #138 | Exceptional 2.2% |
| Brazilians | 92.8 /100 | #139 | Exceptional 2.2% |
| British | 92.8 /100 | #140 | Exceptional 2.2% |
| Laotians | 92.5 /100 | #141 | Exceptional 2.2% |