Lithuanian vs Immigrants from Lebanon Single Father Households
COMPARE
Lithuanian
Immigrants from Lebanon
Single Father Households
Single Father Households Comparison
Lithuanians
Immigrants from Lebanon
2.1%
SINGLE FATHER HOUSEHOLDS
99.5/ 100
METRIC RATING
87th/ 347
METRIC RANK
2.0%
SINGLE FATHER HOUSEHOLDS
100.0/ 100
METRIC RATING
46th/ 347
METRIC RANK
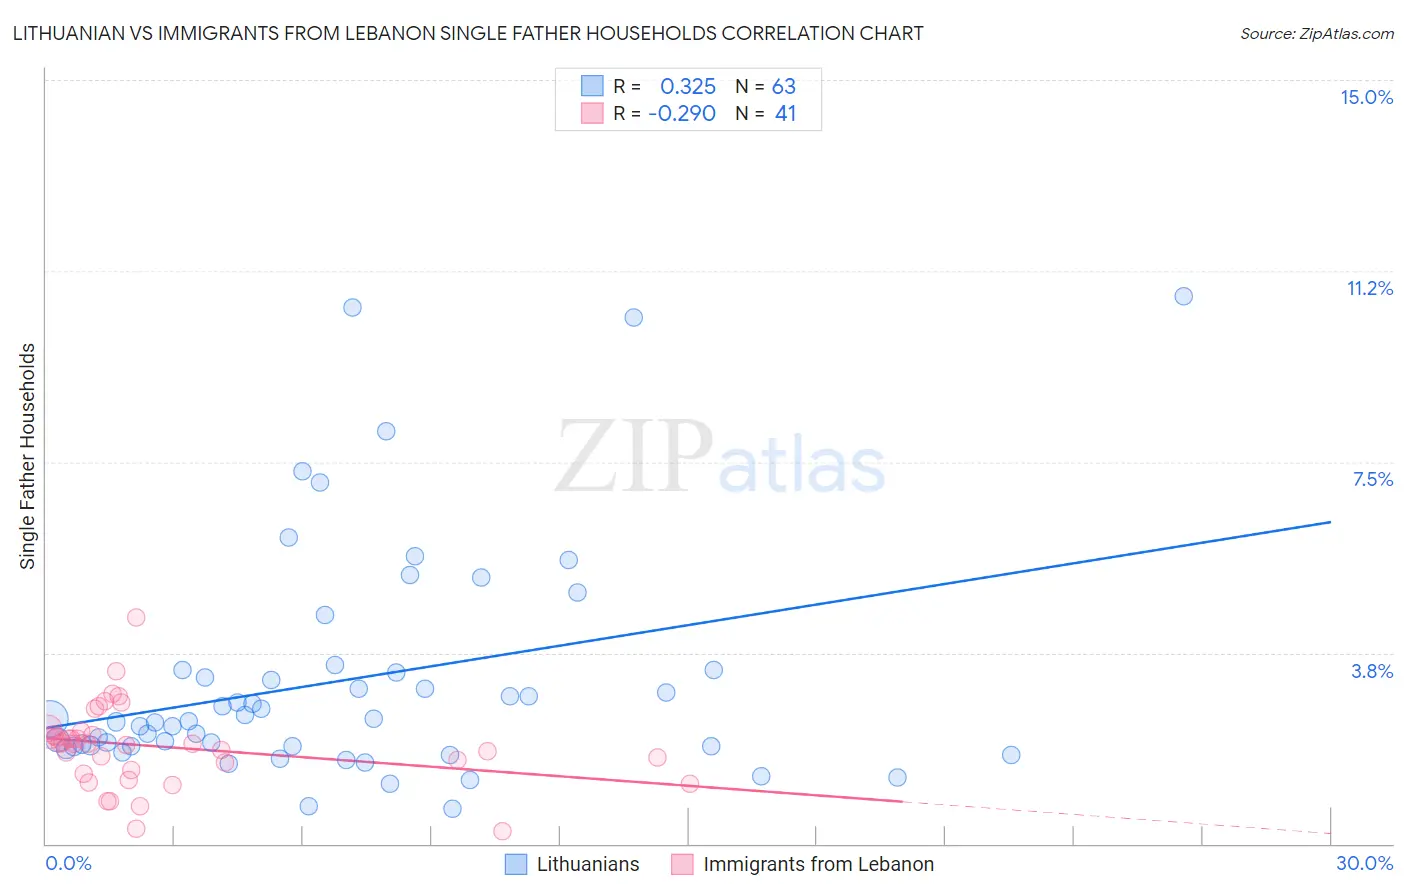
Lithuanian vs Immigrants from Lebanon Single Father Households Correlation Chart
The statistical analysis conducted on geographies consisting of 416,616,302 people shows a mild positive correlation between the proportion of Lithuanians and percentage of single father households in the United States with a correlation coefficient (R) of 0.325 and weighted average of 2.1%. Similarly, the statistical analysis conducted on geographies consisting of 216,181,283 people shows a weak negative correlation between the proportion of Immigrants from Lebanon and percentage of single father households in the United States with a correlation coefficient (R) of -0.290 and weighted average of 2.0%, a difference of 5.1%.
Single Father Households Correlation Summary
| Measurement | Lithuanian | Immigrants from Lebanon |
| Minimum | 0.69% | 0.25% |
| Maximum | 10.7% | 4.4% |
| Range | 10.0% | 4.2% |
| Mean | 3.2% | 1.9% |
| Median | 2.4% | 2.0% |
| Interquartile 25% (IQ1) | 1.9% | 1.4% |
| Interquartile 75% (IQ3) | 3.4% | 2.2% |
| Interquartile Range (IQR) | 1.5% | 0.76% |
| Standard Deviation (Sample) | 2.3% | 0.80% |
| Standard Deviation (Population) | 2.3% | 0.79% |
Similar Demographics by Single Father Households
Demographics Similar to Lithuanians by Single Father Households
In terms of single father households, the demographic groups most similar to Lithuanians are Bhutanese (2.1%, a difference of 0.13%), Immigrants from Armenia (2.1%, a difference of 0.18%), Immigrants from Pakistan (2.1%, a difference of 0.19%), Immigrants from Guyana (2.1%, a difference of 0.43%), and Asian (2.1%, a difference of 0.51%).
| Demographics | Rating | Rank | Single Father Households |
| Immigrants | South Africa | 99.7 /100 | #80 | Exceptional 2.1% |
| Armenians | 99.7 /100 | #81 | Exceptional 2.1% |
| New Zealanders | 99.7 /100 | #82 | Exceptional 2.1% |
| Greeks | 99.7 /100 | #83 | Exceptional 2.1% |
| Carpatho Rusyns | 99.6 /100 | #84 | Exceptional 2.1% |
| Immigrants | Hungary | 99.6 /100 | #85 | Exceptional 2.1% |
| Asians | 99.6 /100 | #86 | Exceptional 2.1% |
| Lithuanians | 99.5 /100 | #87 | Exceptional 2.1% |
| Bhutanese | 99.5 /100 | #88 | Exceptional 2.1% |
| Immigrants | Armenia | 99.5 /100 | #89 | Exceptional 2.1% |
| Immigrants | Pakistan | 99.5 /100 | #90 | Exceptional 2.1% |
| Immigrants | Guyana | 99.4 /100 | #91 | Exceptional 2.1% |
| Romanians | 99.4 /100 | #92 | Exceptional 2.1% |
| Croatians | 99.3 /100 | #93 | Exceptional 2.1% |
| Ukrainians | 99.3 /100 | #94 | Exceptional 2.1% |
Demographics Similar to Immigrants from Lebanon by Single Father Households
In terms of single father households, the demographic groups most similar to Immigrants from Lebanon are Russian (2.0%, a difference of 0.10%), Latvian (2.0%, a difference of 0.12%), Immigrants from Grenada (2.0%, a difference of 0.21%), Immigrants from Ukraine (2.0%, a difference of 0.35%), and Immigrants from Kazakhstan (2.0%, a difference of 0.37%).
| Demographics | Rating | Rank | Single Father Households |
| Immigrants | Sri Lanka | 100.0 /100 | #39 | Exceptional 2.0% |
| Immigrants | Bulgaria | 100.0 /100 | #40 | Exceptional 2.0% |
| Immigrants | Turkey | 100.0 /100 | #41 | Exceptional 2.0% |
| Macedonians | 100.0 /100 | #42 | Exceptional 2.0% |
| Immigrants | Grenada | 100.0 /100 | #43 | Exceptional 2.0% |
| Latvians | 100.0 /100 | #44 | Exceptional 2.0% |
| Russians | 100.0 /100 | #45 | Exceptional 2.0% |
| Immigrants | Lebanon | 100.0 /100 | #46 | Exceptional 2.0% |
| Immigrants | Ukraine | 99.9 /100 | #47 | Exceptional 2.0% |
| Immigrants | Kazakhstan | 99.9 /100 | #48 | Exceptional 2.0% |
| Immigrants | Serbia | 99.9 /100 | #49 | Exceptional 2.0% |
| Immigrants | Switzerland | 99.9 /100 | #50 | Exceptional 2.0% |
| Immigrants | Poland | 99.9 /100 | #51 | Exceptional 2.0% |
| Immigrants | Europe | 99.9 /100 | #52 | Exceptional 2.0% |
| Immigrants | Northern Europe | 99.9 /100 | #53 | Exceptional 2.0% |