Bangladeshi vs Zimbabwean Single Father Households
COMPARE
Bangladeshi
Zimbabwean
Single Father Households
Single Father Households Comparison
Bangladeshis
Zimbabweans
3.1%
SINGLE FATHER HOUSEHOLDS
0.0/ 100
METRIC RATING
327th/ 347
METRIC RANK
2.2%
SINGLE FATHER HOUSEHOLDS
95.1/ 100
METRIC RATING
134th/ 347
METRIC RANK
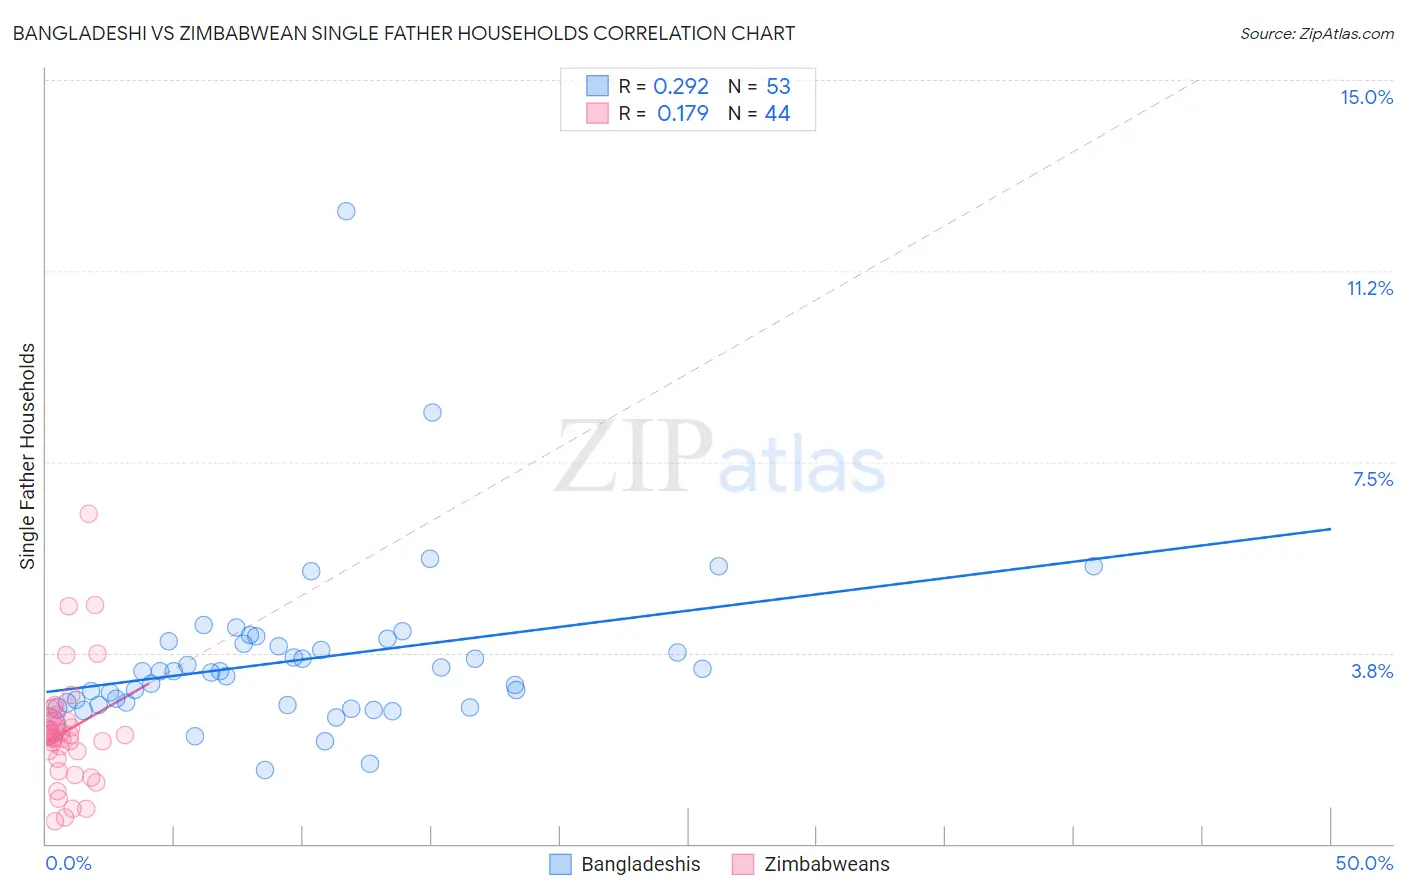
Bangladeshi vs Zimbabwean Single Father Households Correlation Chart
The statistical analysis conducted on geographies consisting of 140,991,030 people shows a weak positive correlation between the proportion of Bangladeshis and percentage of single father households in the United States with a correlation coefficient (R) of 0.292 and weighted average of 3.1%. Similarly, the statistical analysis conducted on geographies consisting of 69,107,979 people shows a poor positive correlation between the proportion of Zimbabweans and percentage of single father households in the United States with a correlation coefficient (R) of 0.179 and weighted average of 2.2%, a difference of 38.9%.
Single Father Households Correlation Summary
| Measurement | Bangladeshi | Zimbabwean |
| Minimum | 1.4% | 0.45% |
| Maximum | 12.4% | 6.5% |
| Range | 11.0% | 6.0% |
| Mean | 3.6% | 2.2% |
| Median | 3.4% | 2.1% |
| Interquartile 25% (IQ1) | 2.7% | 1.7% |
| Interquartile 75% (IQ3) | 3.9% | 2.4% |
| Interquartile Range (IQR) | 1.2% | 0.70% |
| Standard Deviation (Sample) | 1.7% | 1.1% |
| Standard Deviation (Population) | 1.7% | 1.1% |
Similar Demographics by Single Father Households
Demographics Similar to Bangladeshis by Single Father Households
In terms of single father households, the demographic groups most similar to Bangladeshis are Immigrants from Cabo Verde (3.1%, a difference of 0.55%), Chippewa (3.1%, a difference of 0.65%), Aleut (3.0%, a difference of 0.88%), Immigrants from Mexico (3.0%, a difference of 1.1%), and Nepalese (3.1%, a difference of 1.5%).
| Demographics | Rating | Rank | Single Father Households |
| Guatemalans | 0.0 /100 | #320 | Tragic 3.0% |
| Mexicans | 0.0 /100 | #321 | Tragic 3.0% |
| Immigrants | Guatemala | 0.0 /100 | #322 | Tragic 3.0% |
| Immigrants | Central America | 0.0 /100 | #323 | Tragic 3.0% |
| Fijians | 0.0 /100 | #324 | Tragic 3.0% |
| Immigrants | Mexico | 0.0 /100 | #325 | Tragic 3.0% |
| Aleuts | 0.0 /100 | #326 | Tragic 3.0% |
| Bangladeshis | 0.0 /100 | #327 | Tragic 3.1% |
| Immigrants | Cabo Verde | 0.0 /100 | #328 | Tragic 3.1% |
| Chippewa | 0.0 /100 | #329 | Tragic 3.1% |
| Nepalese | 0.0 /100 | #330 | Tragic 3.1% |
| Navajo | 0.0 /100 | #331 | Tragic 3.2% |
| Yaqui | 0.0 /100 | #332 | Tragic 3.2% |
| Natives/Alaskans | 0.0 /100 | #333 | Tragic 3.2% |
| Yuman | 0.0 /100 | #334 | Tragic 3.3% |
Demographics Similar to Zimbabweans by Single Father Households
In terms of single father households, the demographic groups most similar to Zimbabweans are Syrian (2.2%, a difference of 0.11%), Chilean (2.2%, a difference of 0.23%), Austrian (2.2%, a difference of 0.34%), West Indian (2.2%, a difference of 0.37%), and Taiwanese (2.2%, a difference of 0.60%).
| Demographics | Rating | Rank | Single Father Households |
| Jordanians | 96.9 /100 | #127 | Exceptional 2.2% |
| Immigrants | England | 96.8 /100 | #128 | Exceptional 2.2% |
| Serbians | 96.8 /100 | #129 | Exceptional 2.2% |
| Immigrants | Chile | 96.7 /100 | #130 | Exceptional 2.2% |
| Immigrants | Jordan | 96.6 /100 | #131 | Exceptional 2.2% |
| Poles | 96.5 /100 | #132 | Exceptional 2.2% |
| Taiwanese | 96.3 /100 | #133 | Exceptional 2.2% |
| Zimbabweans | 95.1 /100 | #134 | Exceptional 2.2% |
| Syrians | 94.8 /100 | #135 | Exceptional 2.2% |
| Chileans | 94.5 /100 | #136 | Exceptional 2.2% |
| Austrians | 94.2 /100 | #137 | Exceptional 2.2% |
| West Indians | 94.1 /100 | #138 | Exceptional 2.2% |
| Brazilians | 92.8 /100 | #139 | Exceptional 2.2% |
| British | 92.8 /100 | #140 | Exceptional 2.2% |
| Laotians | 92.5 /100 | #141 | Exceptional 2.2% |