Lithuanian vs Native/Alaskan Single Father Households
COMPARE
Lithuanian
Native/Alaskan
Single Father Households
Single Father Households Comparison
Lithuanians
Natives/Alaskans
2.1%
SINGLE FATHER HOUSEHOLDS
99.5/ 100
METRIC RATING
87th/ 347
METRIC RANK
3.2%
SINGLE FATHER HOUSEHOLDS
0.0/ 100
METRIC RATING
333rd/ 347
METRIC RANK
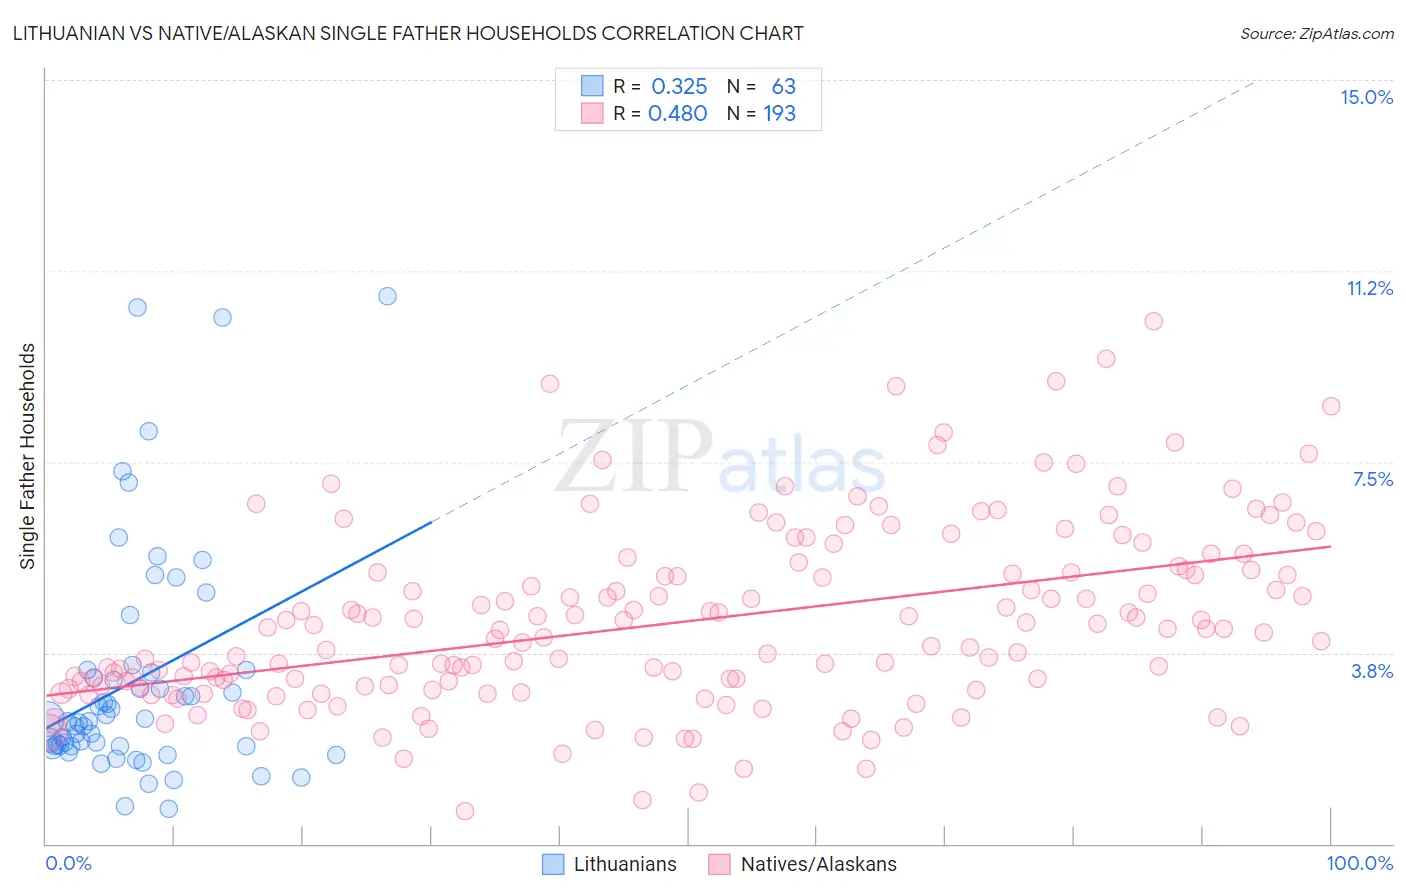
Lithuanian vs Native/Alaskan Single Father Households Correlation Chart
The statistical analysis conducted on geographies consisting of 416,616,302 people shows a mild positive correlation between the proportion of Lithuanians and percentage of single father households in the United States with a correlation coefficient (R) of 0.325 and weighted average of 2.1%. Similarly, the statistical analysis conducted on geographies consisting of 505,226,319 people shows a moderate positive correlation between the proportion of Natives/Alaskans and percentage of single father households in the United States with a correlation coefficient (R) of 0.480 and weighted average of 3.2%, a difference of 51.9%.
Single Father Households Correlation Summary
| Measurement | Lithuanian | Native/Alaskan |
| Minimum | 0.69% | 0.64% |
| Maximum | 10.7% | 10.3% |
| Range | 10.0% | 9.6% |
| Mean | 3.2% | 4.4% |
| Median | 2.4% | 4.1% |
| Interquartile 25% (IQ1) | 1.9% | 3.1% |
| Interquartile 75% (IQ3) | 3.4% | 5.4% |
| Interquartile Range (IQR) | 1.5% | 2.3% |
| Standard Deviation (Sample) | 2.3% | 1.8% |
| Standard Deviation (Population) | 2.3% | 1.8% |
Similar Demographics by Single Father Households
Demographics Similar to Lithuanians by Single Father Households
In terms of single father households, the demographic groups most similar to Lithuanians are Bhutanese (2.1%, a difference of 0.13%), Immigrants from Armenia (2.1%, a difference of 0.18%), Immigrants from Pakistan (2.1%, a difference of 0.19%), Immigrants from Guyana (2.1%, a difference of 0.43%), and Asian (2.1%, a difference of 0.51%).
| Demographics | Rating | Rank | Single Father Households |
| Immigrants | South Africa | 99.7 /100 | #80 | Exceptional 2.1% |
| Armenians | 99.7 /100 | #81 | Exceptional 2.1% |
| New Zealanders | 99.7 /100 | #82 | Exceptional 2.1% |
| Greeks | 99.7 /100 | #83 | Exceptional 2.1% |
| Carpatho Rusyns | 99.6 /100 | #84 | Exceptional 2.1% |
| Immigrants | Hungary | 99.6 /100 | #85 | Exceptional 2.1% |
| Asians | 99.6 /100 | #86 | Exceptional 2.1% |
| Lithuanians | 99.5 /100 | #87 | Exceptional 2.1% |
| Bhutanese | 99.5 /100 | #88 | Exceptional 2.1% |
| Immigrants | Armenia | 99.5 /100 | #89 | Exceptional 2.1% |
| Immigrants | Pakistan | 99.5 /100 | #90 | Exceptional 2.1% |
| Immigrants | Guyana | 99.4 /100 | #91 | Exceptional 2.1% |
| Romanians | 99.4 /100 | #92 | Exceptional 2.1% |
| Croatians | 99.3 /100 | #93 | Exceptional 2.1% |
| Ukrainians | 99.3 /100 | #94 | Exceptional 2.1% |
Demographics Similar to Natives/Alaskans by Single Father Households
In terms of single father households, the demographic groups most similar to Natives/Alaskans are Yaqui (3.2%, a difference of 0.49%), Navajo (3.2%, a difference of 0.54%), Yuman (3.3%, a difference of 2.8%), Colville (3.3%, a difference of 2.8%), and Paiute (3.3%, a difference of 2.8%).
| Demographics | Rating | Rank | Single Father Households |
| Aleuts | 0.0 /100 | #326 | Tragic 3.0% |
| Bangladeshis | 0.0 /100 | #327 | Tragic 3.1% |
| Immigrants | Cabo Verde | 0.0 /100 | #328 | Tragic 3.1% |
| Chippewa | 0.0 /100 | #329 | Tragic 3.1% |
| Nepalese | 0.0 /100 | #330 | Tragic 3.1% |
| Navajo | 0.0 /100 | #331 | Tragic 3.2% |
| Yaqui | 0.0 /100 | #332 | Tragic 3.2% |
| Natives/Alaskans | 0.0 /100 | #333 | Tragic 3.2% |
| Yuman | 0.0 /100 | #334 | Tragic 3.3% |
| Colville | 0.0 /100 | #335 | Tragic 3.3% |
| Paiute | 0.0 /100 | #336 | Tragic 3.3% |
| Pueblo | 0.0 /100 | #337 | Tragic 3.3% |
| Sioux | 0.0 /100 | #338 | Tragic 3.3% |
| Alaskan Athabascans | 0.0 /100 | #339 | Tragic 3.4% |
| Alaska Natives | 0.0 /100 | #340 | Tragic 3.5% |