Danish vs Menominee Currently Married
COMPARE
Danish
Menominee
Currently Married
Currently Married Comparison
Danes
Menominee
50.5%
CURRENTLY MARRIED
100.0/ 100
METRIC RATING
5th/ 347
METRIC RANK
42.3%
CURRENTLY MARRIED
0.0/ 100
METRIC RATING
296th/ 347
METRIC RANK
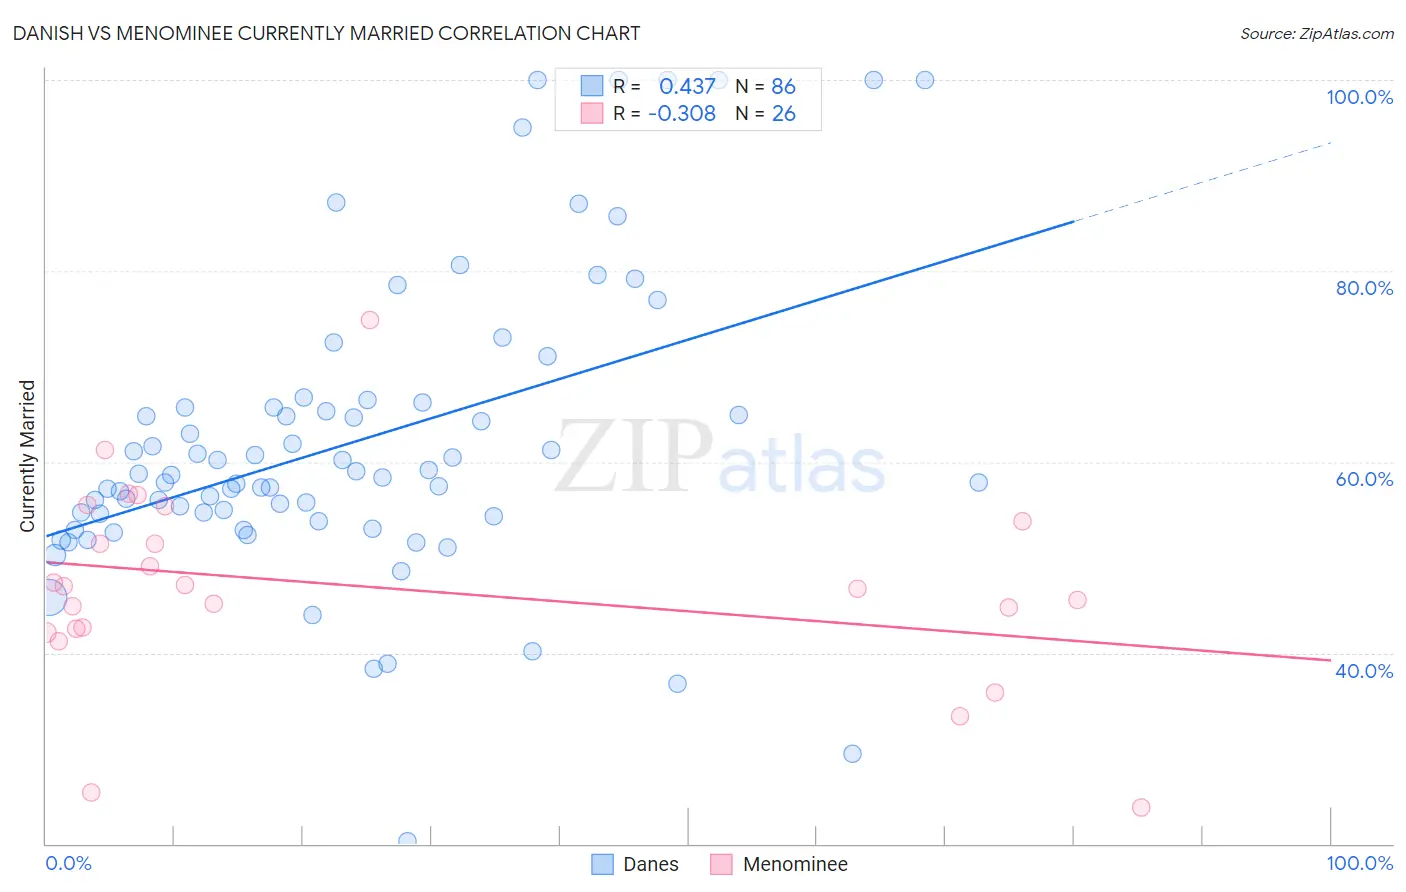
Danish vs Menominee Currently Married Correlation Chart
The statistical analysis conducted on geographies consisting of 474,135,576 people shows a moderate positive correlation between the proportion of Danes and percentage of population currently married in the United States with a correlation coefficient (R) of 0.437 and weighted average of 50.5%. Similarly, the statistical analysis conducted on geographies consisting of 45,778,979 people shows a mild negative correlation between the proportion of Menominee and percentage of population currently married in the United States with a correlation coefficient (R) of -0.308 and weighted average of 42.3%, a difference of 19.3%.
Currently Married Correlation Summary
| Measurement | Danish | Menominee |
| Minimum | 20.3% | 23.8% |
| Maximum | 100.0% | 74.8% |
| Range | 79.7% | 51.0% |
| Mean | 62.1% | 47.0% |
| Median | 58.5% | 46.8% |
| Interquartile 25% (IQ1) | 54.3% | 42.5% |
| Interquartile 75% (IQ3) | 65.8% | 53.8% |
| Interquartile Range (IQR) | 11.5% | 11.3% |
| Standard Deviation (Sample) | 15.8% | 10.6% |
| Standard Deviation (Population) | 15.7% | 10.4% |
Similar Demographics by Currently Married
Demographics Similar to Danes by Currently Married
In terms of currently married, the demographic groups most similar to Danes are Norwegian (50.2%, a difference of 0.54%), Immigrants from Taiwan (50.7%, a difference of 0.55%), Assyrian/Chaldean/Syriac (50.8%, a difference of 0.63%), Thai (50.9%, a difference of 0.81%), and Immigrants from South Central Asia (50.0%, a difference of 0.88%).
| Demographics | Rating | Rank | Currently Married |
| Immigrants | India | 100.0 /100 | #1 | Exceptional 51.8% |
| Thais | 100.0 /100 | #2 | Exceptional 50.9% |
| Assyrians/Chaldeans/Syriacs | 100.0 /100 | #3 | Exceptional 50.8% |
| Immigrants | Taiwan | 100.0 /100 | #4 | Exceptional 50.7% |
| Danes | 100.0 /100 | #5 | Exceptional 50.5% |
| Norwegians | 100.0 /100 | #6 | Exceptional 50.2% |
| Immigrants | South Central Asia | 100.0 /100 | #7 | Exceptional 50.0% |
| Swedes | 100.0 /100 | #8 | Exceptional 50.0% |
| Czechs | 99.9 /100 | #9 | Exceptional 49.9% |
| Filipinos | 99.9 /100 | #10 | Exceptional 49.7% |
| English | 99.9 /100 | #11 | Exceptional 49.7% |
| Swiss | 99.9 /100 | #12 | Exceptional 49.7% |
| Dutch | 99.9 /100 | #13 | Exceptional 49.6% |
| Germans | 99.9 /100 | #14 | Exceptional 49.6% |
| Pennsylvania Germans | 99.9 /100 | #15 | Exceptional 49.6% |
Demographics Similar to Menominee by Currently Married
In terms of currently married, the demographic groups most similar to Menominee are Cheyenne (42.2%, a difference of 0.11%), Immigrants from Honduras (42.2%, a difference of 0.20%), Immigrants from Western Africa (42.4%, a difference of 0.21%), Liberian (42.2%, a difference of 0.23%), and Belizean (42.2%, a difference of 0.33%).
| Demographics | Rating | Rank | Currently Married |
| Paiute | 0.0 /100 | #289 | Tragic 42.7% |
| Immigrants | Ghana | 0.0 /100 | #290 | Tragic 42.7% |
| Immigrants | Guatemala | 0.0 /100 | #291 | Tragic 42.6% |
| Sub-Saharan Africans | 0.0 /100 | #292 | Tragic 42.6% |
| Yuman | 0.0 /100 | #293 | Tragic 42.6% |
| Hondurans | 0.0 /100 | #294 | Tragic 42.5% |
| Immigrants | Western Africa | 0.0 /100 | #295 | Tragic 42.4% |
| Menominee | 0.0 /100 | #296 | Tragic 42.3% |
| Cheyenne | 0.0 /100 | #297 | Tragic 42.2% |
| Immigrants | Honduras | 0.0 /100 | #298 | Tragic 42.2% |
| Liberians | 0.0 /100 | #299 | Tragic 42.2% |
| Belizeans | 0.0 /100 | #300 | Tragic 42.2% |
| Immigrants | Yemen | 0.0 /100 | #301 | Tragic 42.1% |
| Immigrants | Zaire | 0.0 /100 | #302 | Tragic 42.0% |
| Sioux | 0.0 /100 | #303 | Tragic 41.9% |