Lebanese vs Aleut Average Family Size
COMPARE
Lebanese
Aleut
Average Family Size
Average Family Size Comparison
Lebanese
Aleuts
3.19
AVERAGE FAMILY SIZE
9.1/ 100
METRIC RATING
220th/ 347
METRIC RANK
3.23
AVERAGE FAMILY SIZE
54.1/ 100
METRIC RATING
169th/ 347
METRIC RANK
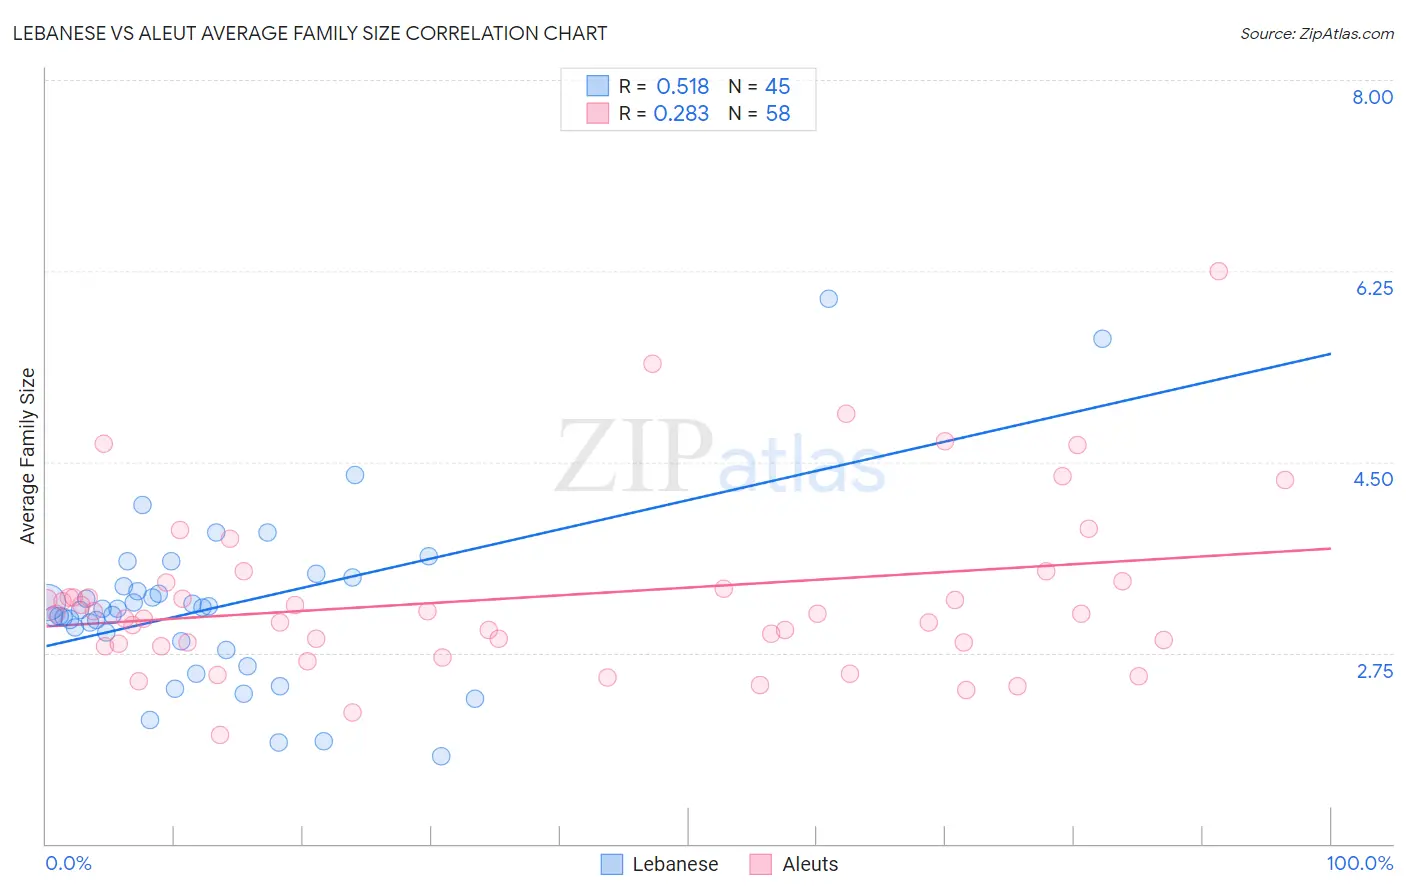
Lebanese vs Aleut Average Family Size Correlation Chart
The statistical analysis conducted on geographies consisting of 401,332,213 people shows a substantial positive correlation between the proportion of Lebanese and average family size in the United States with a correlation coefficient (R) of 0.518 and weighted average of 3.19. Similarly, the statistical analysis conducted on geographies consisting of 61,774,042 people shows a weak positive correlation between the proportion of Aleuts and average family size in the United States with a correlation coefficient (R) of 0.283 and weighted average of 3.23, a difference of 1.1%.
Average Family Size Correlation Summary
| Measurement | Lebanese | Aleut |
| Minimum | 1.80 | 2.00 |
| Maximum | 6.00 | 6.25 |
| Range | 4.20 | 4.25 |
| Mean | 3.18 | 3.26 |
| Median | 3.15 | 3.11 |
| Interquartile 25% (IQ1) | 2.82 | 2.84 |
| Interquartile 75% (IQ3) | 3.40 | 3.39 |
| Interquartile Range (IQR) | 0.58 | 0.55 |
| Standard Deviation (Sample) | 0.79 | 0.80 |
| Standard Deviation (Population) | 0.78 | 0.79 |
Similar Demographics by Average Family Size
Demographics Similar to Lebanese by Average Family Size
In terms of average family size, the demographic groups most similar to Lebanese are Pennsylvania German (3.19, a difference of 0.010%), French American Indian (3.20, a difference of 0.040%), Immigrants from Somalia (3.20, a difference of 0.060%), Delaware (3.20, a difference of 0.10%), and Bermudan (3.20, a difference of 0.10%).
| Demographics | Rating | Rank | Average Family Size |
| Mongolians | 11.5 /100 | #213 | Poor 3.20 |
| Somalis | 11.2 /100 | #214 | Poor 3.20 |
| Delaware | 11.1 /100 | #215 | Poor 3.20 |
| Bermudans | 11.0 /100 | #216 | Poor 3.20 |
| Immigrants | Somalia | 10.3 /100 | #217 | Poor 3.20 |
| French American Indians | 9.8 /100 | #218 | Tragic 3.20 |
| Pennsylvania Germans | 9.3 /100 | #219 | Tragic 3.19 |
| Lebanese | 9.1 /100 | #220 | Tragic 3.19 |
| Immigrants | Ukraine | 7.2 /100 | #221 | Tragic 3.19 |
| Immigrants | Kuwait | 7.2 /100 | #222 | Tragic 3.19 |
| Immigrants | Zimbabwe | 7.1 /100 | #223 | Tragic 3.19 |
| Syrians | 6.5 /100 | #224 | Tragic 3.19 |
| Cree | 6.2 /100 | #225 | Tragic 3.19 |
| Chickasaw | 6.0 /100 | #226 | Tragic 3.19 |
| Portuguese | 6.0 /100 | #227 | Tragic 3.19 |
Demographics Similar to Aleuts by Average Family Size
In terms of average family size, the demographic groups most similar to Aleuts are Taiwanese (3.23, a difference of 0.0%), Arab (3.23, a difference of 0.010%), Chilean (3.23, a difference of 0.020%), Immigrants from Congo (3.23, a difference of 0.030%), and Immigrants from Uruguay (3.23, a difference of 0.040%).
| Demographics | Rating | Rank | Average Family Size |
| Immigrants | Uganda | 60.1 /100 | #162 | Good 3.23 |
| Uruguayans | 58.8 /100 | #163 | Average 3.23 |
| Egyptians | 58.6 /100 | #164 | Average 3.23 |
| Ugandans | 58.4 /100 | #165 | Average 3.23 |
| Immigrants | Senegal | 57.5 /100 | #166 | Average 3.23 |
| Dutch West Indians | 56.9 /100 | #167 | Average 3.23 |
| Taiwanese | 54.2 /100 | #168 | Average 3.23 |
| Aleuts | 54.1 /100 | #169 | Average 3.23 |
| Arabs | 53.8 /100 | #170 | Average 3.23 |
| Chileans | 53.2 /100 | #171 | Average 3.23 |
| Immigrants | Congo | 52.7 /100 | #172 | Average 3.23 |
| Immigrants | Uruguay | 52.0 /100 | #173 | Average 3.23 |
| Immigrants | South Central Asia | 50.0 /100 | #174 | Average 3.23 |
| Immigrants | China | 49.9 /100 | #175 | Average 3.23 |
| Israelis | 48.7 /100 | #176 | Average 3.23 |