Immigrants from Guyana vs Iraqi Average Family Size
COMPARE
Immigrants from Guyana
Iraqi
Average Family Size
Average Family Size Comparison
Immigrants from Guyana
Iraqis
3.40
AVERAGE FAMILY SIZE
100.0/ 100
METRIC RATING
36th/ 347
METRIC RANK
3.24
AVERAGE FAMILY SIZE
64.3/ 100
METRIC RATING
158th/ 347
METRIC RANK
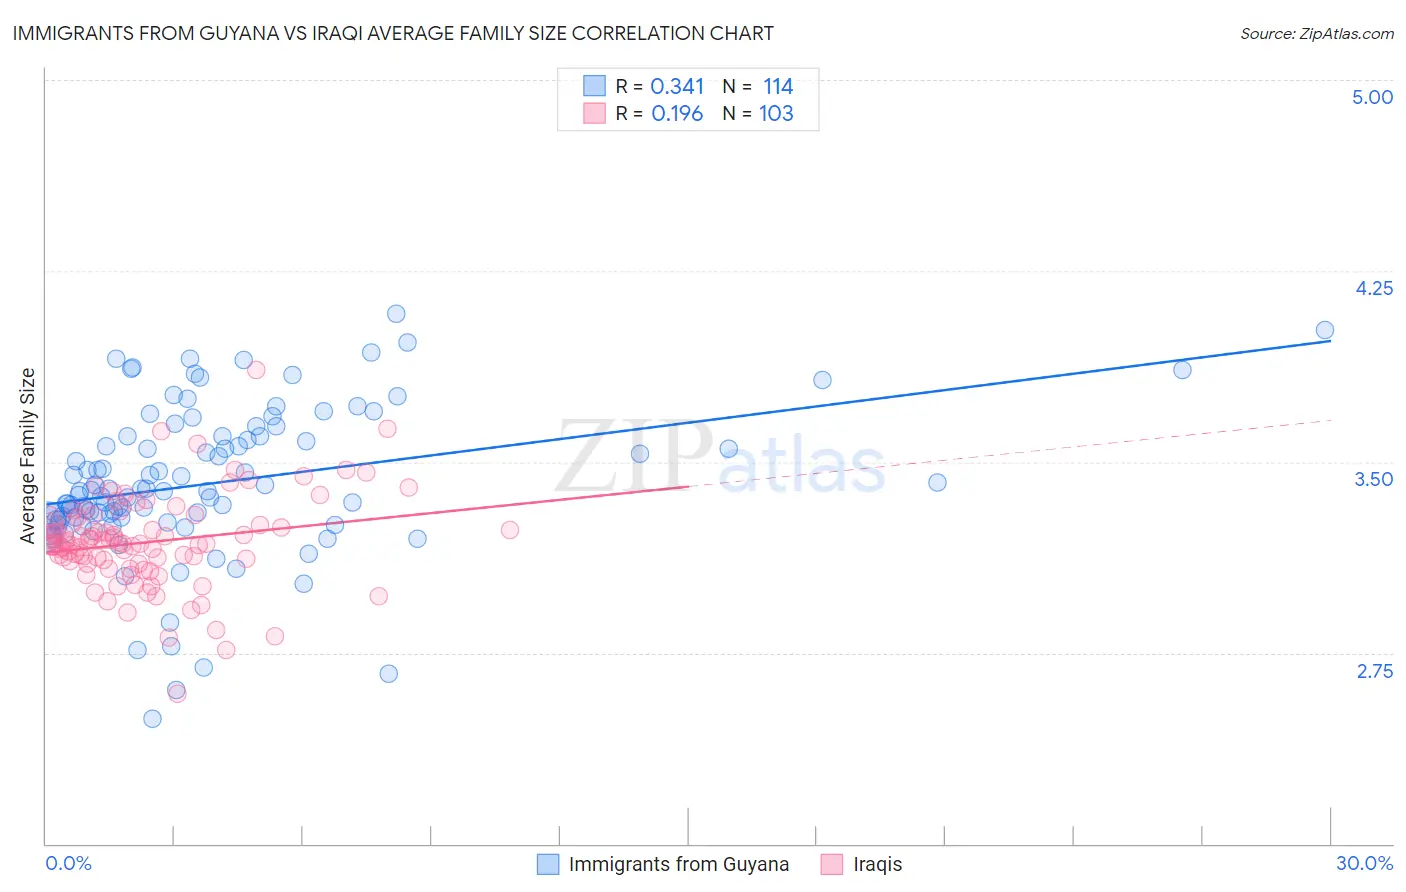
Immigrants from Guyana vs Iraqi Average Family Size Correlation Chart
The statistical analysis conducted on geographies consisting of 183,692,650 people shows a mild positive correlation between the proportion of Immigrants from Guyana and average family size in the United States with a correlation coefficient (R) of 0.341 and weighted average of 3.40. Similarly, the statistical analysis conducted on geographies consisting of 170,567,061 people shows a poor positive correlation between the proportion of Iraqis and average family size in the United States with a correlation coefficient (R) of 0.196 and weighted average of 3.24, a difference of 5.1%.
Average Family Size Correlation Summary
| Measurement | Immigrants from Guyana | Iraqi |
| Minimum | 2.49 | 2.59 |
| Maximum | 4.08 | 3.86 |
| Range | 1.59 | 1.27 |
| Mean | 3.42 | 3.19 |
| Median | 3.38 | 3.18 |
| Interquartile 25% (IQ1) | 3.27 | 3.10 |
| Interquartile 75% (IQ3) | 3.60 | 3.26 |
| Interquartile Range (IQR) | 0.33 | 0.16 |
| Standard Deviation (Sample) | 0.30 | 0.18 |
| Standard Deviation (Population) | 0.30 | 0.18 |
Similar Demographics by Average Family Size
Demographics Similar to Immigrants from Guyana by Average Family Size
In terms of average family size, the demographic groups most similar to Immigrants from Guyana are Guatemalan (3.40, a difference of 0.050%), Hispanic or Latino (3.41, a difference of 0.11%), Guyanese (3.40, a difference of 0.14%), Hawaiian (3.41, a difference of 0.16%), and Immigrants from Guatemala (3.41, a difference of 0.19%).
| Demographics | Rating | Rank | Average Family Size |
| Nepalese | 100.0 /100 | #29 | Exceptional 3.42 |
| Samoans | 100.0 /100 | #30 | Exceptional 3.42 |
| Central Americans | 100.0 /100 | #31 | Exceptional 3.41 |
| Immigrants | Guatemala | 100.0 /100 | #32 | Exceptional 3.41 |
| Hawaiians | 100.0 /100 | #33 | Exceptional 3.41 |
| Hispanics or Latinos | 100.0 /100 | #34 | Exceptional 3.41 |
| Guatemalans | 100.0 /100 | #35 | Exceptional 3.40 |
| Immigrants | Guyana | 100.0 /100 | #36 | Exceptional 3.40 |
| Guyanese | 100.0 /100 | #37 | Exceptional 3.40 |
| Immigrants | Belize | 100.0 /100 | #38 | Exceptional 3.39 |
| Immigrants | Haiti | 100.0 /100 | #39 | Exceptional 3.39 |
| Belizeans | 100.0 /100 | #40 | Exceptional 3.39 |
| Marshallese | 100.0 /100 | #41 | Exceptional 3.38 |
| Immigrants | Vietnam | 100.0 /100 | #42 | Exceptional 3.38 |
| Immigrants | Philippines | 100.0 /100 | #43 | Exceptional 3.37 |
Demographics Similar to Iraqis by Average Family Size
In terms of average family size, the demographic groups most similar to Iraqis are Ethiopian (3.24, a difference of 0.010%), Immigrants from Iraq (3.24, a difference of 0.010%), Immigrants from Chile (3.24, a difference of 0.020%), Immigrants from Uzbekistan (3.24, a difference of 0.050%), and Seminole (3.24, a difference of 0.080%).
| Demographics | Rating | Rank | Average Family Size |
| Jordanians | 73.5 /100 | #151 | Good 3.24 |
| Spanish Americans | 72.5 /100 | #152 | Good 3.24 |
| Immigrants | Eritrea | 71.4 /100 | #153 | Good 3.24 |
| Immigrants | Egypt | 70.0 /100 | #154 | Good 3.24 |
| Seminole | 68.2 /100 | #155 | Good 3.24 |
| Immigrants | Taiwan | 68.1 /100 | #156 | Good 3.24 |
| Immigrants | Uzbekistan | 67.0 /100 | #157 | Good 3.24 |
| Iraqis | 64.3 /100 | #158 | Good 3.24 |
| Ethiopians | 63.9 /100 | #159 | Good 3.24 |
| Immigrants | Iraq | 63.7 /100 | #160 | Good 3.24 |
| Immigrants | Chile | 63.2 /100 | #161 | Good 3.24 |
| Immigrants | Uganda | 60.1 /100 | #162 | Good 3.23 |
| Uruguayans | 58.8 /100 | #163 | Average 3.23 |
| Egyptians | 58.6 /100 | #164 | Average 3.23 |
| Ugandans | 58.4 /100 | #165 | Average 3.23 |