Lebanese vs Immigrants from Italy Average Family Size
COMPARE
Lebanese
Immigrants from Italy
Average Family Size
Average Family Size Comparison
Lebanese
Immigrants from Italy
3.19
AVERAGE FAMILY SIZE
9.1/ 100
METRIC RATING
220th/ 347
METRIC RANK
3.19
AVERAGE FAMILY SIZE
5.3/ 100
METRIC RATING
229th/ 347
METRIC RANK
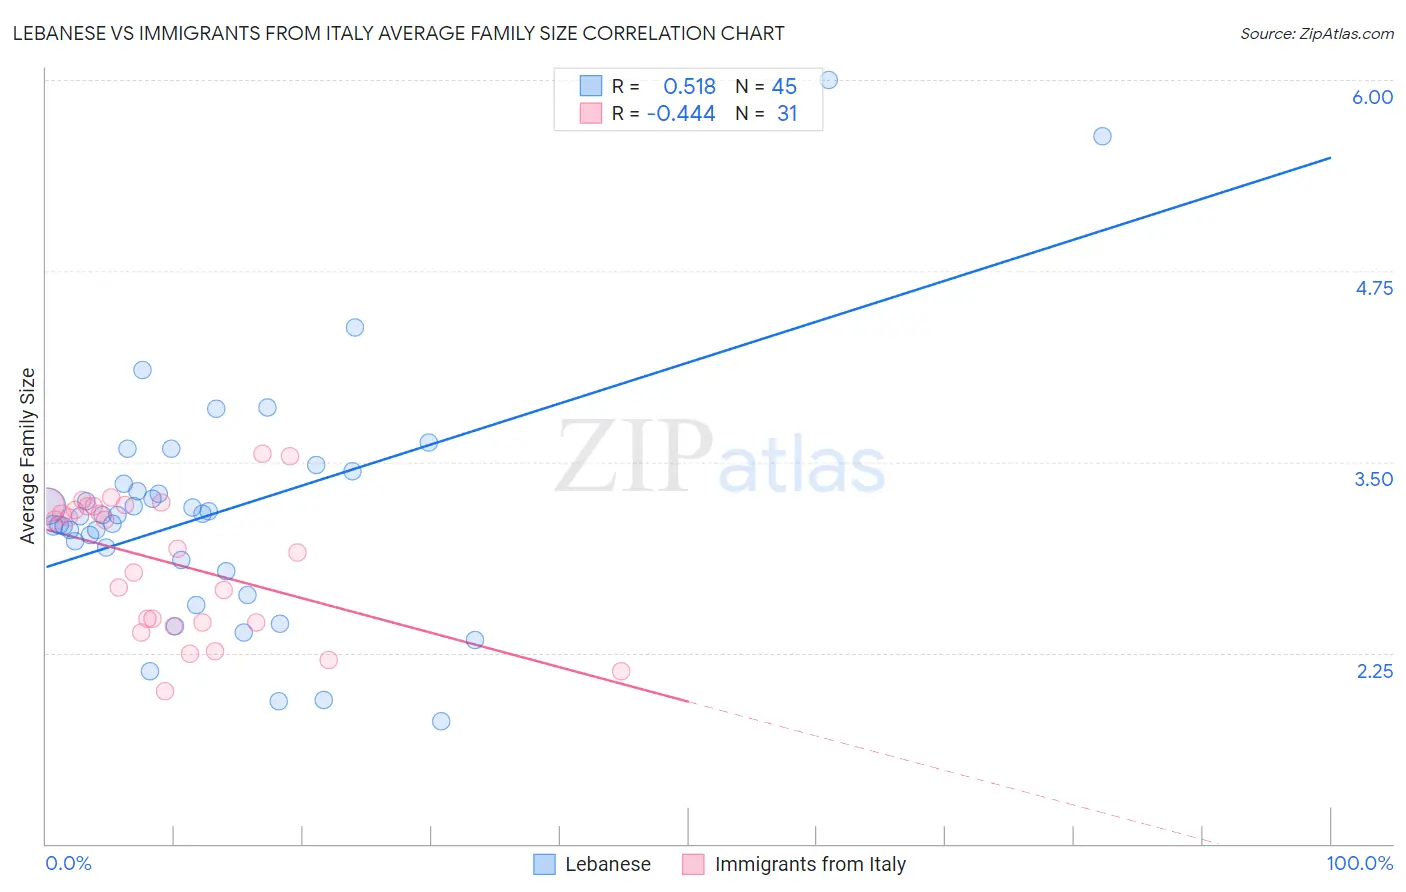
Lebanese vs Immigrants from Italy Average Family Size Correlation Chart
The statistical analysis conducted on geographies consisting of 401,332,213 people shows a substantial positive correlation between the proportion of Lebanese and average family size in the United States with a correlation coefficient (R) of 0.518 and weighted average of 3.19. Similarly, the statistical analysis conducted on geographies consisting of 324,146,965 people shows a moderate negative correlation between the proportion of Immigrants from Italy and average family size in the United States with a correlation coefficient (R) of -0.444 and weighted average of 3.19, a difference of 0.27%.
Average Family Size Correlation Summary
| Measurement | Lebanese | Immigrants from Italy |
| Minimum | 1.80 | 2.00 |
| Maximum | 6.00 | 3.55 |
| Range | 4.20 | 1.55 |
| Mean | 3.18 | 2.84 |
| Median | 3.15 | 2.93 |
| Interquartile 25% (IQ1) | 2.82 | 2.45 |
| Interquartile 75% (IQ3) | 3.40 | 3.21 |
| Interquartile Range (IQR) | 0.58 | 0.76 |
| Standard Deviation (Sample) | 0.79 | 0.45 |
| Standard Deviation (Population) | 0.78 | 0.44 |
Demographics Similar to Lebanese and Immigrants from Italy by Average Family Size
In terms of average family size, the demographic groups most similar to Lebanese are Pennsylvania German (3.19, a difference of 0.010%), French American Indian (3.20, a difference of 0.040%), Immigrants from Somalia (3.20, a difference of 0.060%), Delaware (3.20, a difference of 0.10%), and Bermudan (3.20, a difference of 0.10%). Similarly, the demographic groups most similar to Immigrants from Italy are Icelander (3.19, a difference of 0.010%), Basque (3.19, a difference of 0.010%), Nonimmigrants (3.19, a difference of 0.040%), Chickasaw (3.19, a difference of 0.060%), and Portuguese (3.19, a difference of 0.060%).
| Demographics | Rating | Rank | Average Family Size |
| Somalis | 11.2 /100 | #214 | Poor 3.20 |
| Delaware | 11.1 /100 | #215 | Poor 3.20 |
| Bermudans | 11.0 /100 | #216 | Poor 3.20 |
| Immigrants | Somalia | 10.3 /100 | #217 | Poor 3.20 |
| French American Indians | 9.8 /100 | #218 | Tragic 3.20 |
| Pennsylvania Germans | 9.3 /100 | #219 | Tragic 3.19 |
| Lebanese | 9.1 /100 | #220 | Tragic 3.19 |
| Immigrants | Ukraine | 7.2 /100 | #221 | Tragic 3.19 |
| Immigrants | Kuwait | 7.2 /100 | #222 | Tragic 3.19 |
| Immigrants | Zimbabwe | 7.1 /100 | #223 | Tragic 3.19 |
| Syrians | 6.5 /100 | #224 | Tragic 3.19 |
| Cree | 6.2 /100 | #225 | Tragic 3.19 |
| Chickasaw | 6.0 /100 | #226 | Tragic 3.19 |
| Portuguese | 6.0 /100 | #227 | Tragic 3.19 |
| Immigrants | Nonimmigrants | 5.7 /100 | #228 | Tragic 3.19 |
| Immigrants | Italy | 5.3 /100 | #229 | Tragic 3.19 |
| Icelanders | 5.2 /100 | #230 | Tragic 3.19 |
| Basques | 5.2 /100 | #231 | Tragic 3.19 |
| Cherokee | 4.7 /100 | #232 | Tragic 3.18 |
| Brazilians | 4.5 /100 | #233 | Tragic 3.18 |
| Iranians | 4.5 /100 | #234 | Tragic 3.18 |