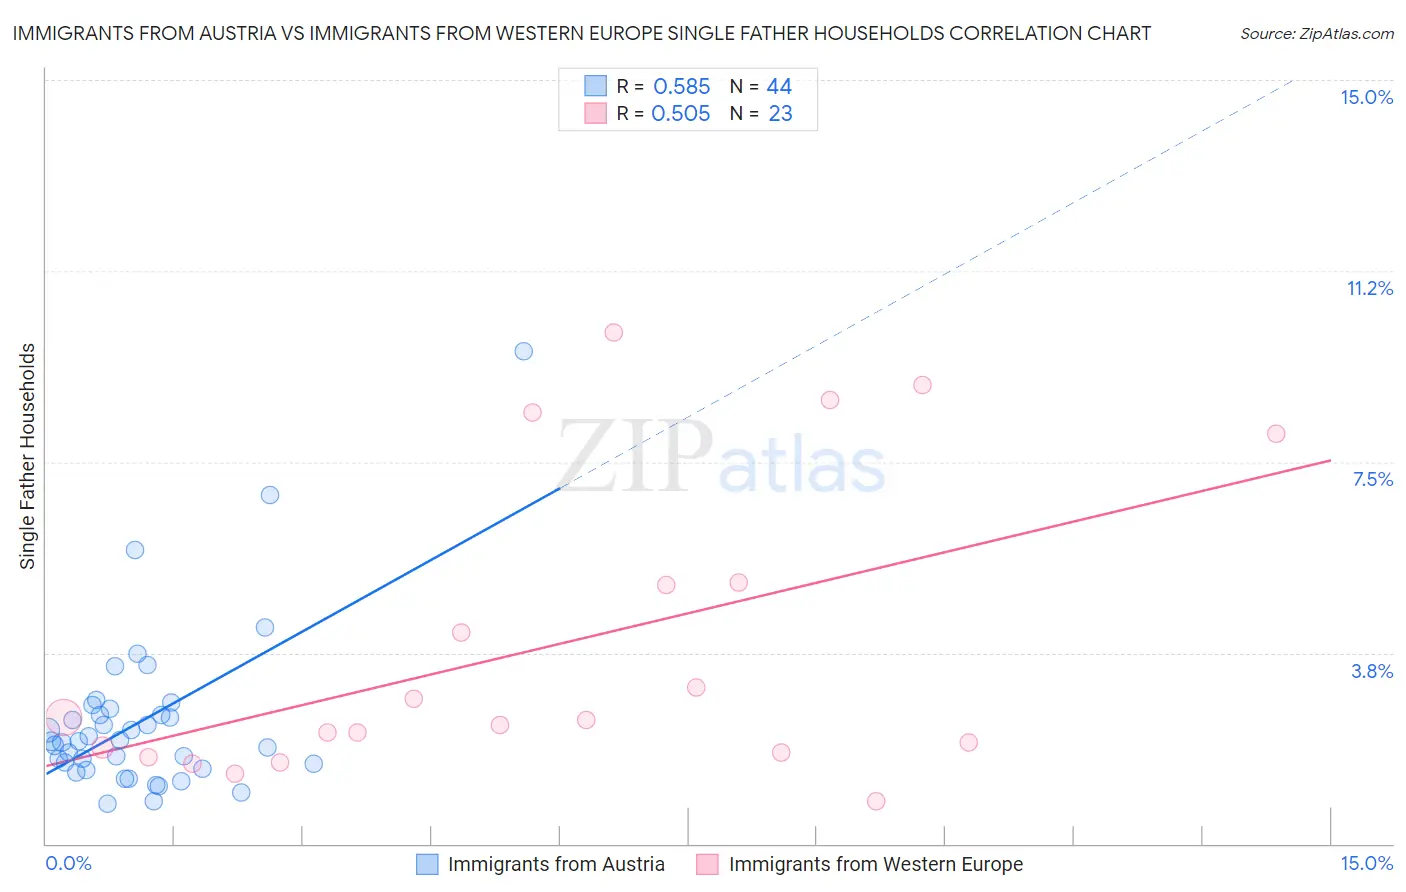
Immigrants from Austria vs Immigrants from Western Europe Single Father Households
COMPARE
Immigrants from Austria
Immigrants from Western Europe
Single Father Households
Single Father Households Comparison
Immigrants from Austria
Immigrants from Western Europe
2.0%
SINGLE FATHER HOUSEHOLDS
99.9/ 100
METRIC RATING
60th/ 347
METRIC RANK
2.1%
SINGLE FATHER HOUSEHOLDS
98.9/ 100
METRIC RATING
101st/ 347
METRIC RANK
Immigrants from Austria vs Immigrants from Western Europe Single Father Households Correlation Chart
The statistical analysis conducted on geographies consisting of 166,908,131 people shows a substantial positive correlation between the proportion of Immigrants from Austria and percentage of single father households in the United States with a correlation coefficient (R) of 0.585 and weighted average of 2.0%. Similarly, the statistical analysis conducted on geographies consisting of 486,889,765 people shows a substantial positive correlation between the proportion of Immigrants from Western Europe and percentage of single father households in the United States with a correlation coefficient (R) of 0.505 and weighted average of 2.1%, a difference of 5.3%.
Single Father Households Correlation Summary
| Measurement | Immigrants from Austria | Immigrants from Western Europe |
| Minimum | 0.78% | 0.84% |
| Maximum | 9.7% | 10.0% |
| Range | 8.9% | 9.2% |
| Mean | 2.4% | 3.9% |
| Median | 2.0% | 2.4% |
| Interquartile 25% (IQ1) | 1.5% | 1.8% |
| Interquartile 75% (IQ3) | 2.6% | 5.1% |
| Interquartile Range (IQR) | 1.1% | 3.3% |
| Standard Deviation (Sample) | 1.6% | 2.9% |
| Standard Deviation (Population) | 1.6% | 2.8% |
Similar Demographics by Single Father Households
Demographics Similar to Immigrants from Austria by Single Father Households
In terms of single father households, the demographic groups most similar to Immigrants from Austria are Immigrants from North Macedonia (2.0%, a difference of 0.010%), Immigrants from Czechoslovakia (2.0%, a difference of 0.11%), Burmese (2.0%, a difference of 0.14%), Vietnamese (2.0%, a difference of 0.24%), and Immigrants from Norway (2.0%, a difference of 0.40%).
| Demographics | Rating | Rank | Single Father Households |
| Immigrants | Northern Europe | 99.9 /100 | #53 | Exceptional 2.0% |
| Immigrants | Korea | 99.9 /100 | #54 | Exceptional 2.0% |
| Immigrants | France | 99.9 /100 | #55 | Exceptional 2.0% |
| Immigrants | Norway | 99.9 /100 | #56 | Exceptional 2.0% |
| Burmese | 99.9 /100 | #57 | Exceptional 2.0% |
| Immigrants | Czechoslovakia | 99.9 /100 | #58 | Exceptional 2.0% |
| Immigrants | North Macedonia | 99.9 /100 | #59 | Exceptional 2.0% |
| Immigrants | Austria | 99.9 /100 | #60 | Exceptional 2.0% |
| Vietnamese | 99.9 /100 | #61 | Exceptional 2.0% |
| Immigrants | Malaysia | 99.9 /100 | #62 | Exceptional 2.0% |
| Maltese | 99.9 /100 | #63 | Exceptional 2.0% |
| Mongolians | 99.9 /100 | #64 | Exceptional 2.1% |
| Paraguayans | 99.9 /100 | #65 | Exceptional 2.1% |
| Immigrants | Western Asia | 99.8 /100 | #66 | Exceptional 2.1% |
| Immigrants | Italy | 99.8 /100 | #67 | Exceptional 2.1% |
Demographics Similar to Immigrants from Western Europe by Single Father Households
In terms of single father households, the demographic groups most similar to Immigrants from Western Europe are Argentinean (2.1%, a difference of 0.030%), Lebanese (2.1%, a difference of 0.050%), Alsatian (2.1%, a difference of 0.070%), Immigrants from Northern Africa (2.1%, a difference of 0.15%), and South African (2.1%, a difference of 0.30%).
| Demographics | Rating | Rank | Single Father Households |
| Ukrainians | 99.3 /100 | #94 | Exceptional 2.1% |
| Bermudans | 99.2 /100 | #95 | Exceptional 2.1% |
| Arabs | 99.2 /100 | #96 | Exceptional 2.1% |
| Immigrants | Moldova | 99.1 /100 | #97 | Exceptional 2.1% |
| Guyanese | 99.1 /100 | #98 | Exceptional 2.1% |
| South Africans | 99.1 /100 | #99 | Exceptional 2.1% |
| Immigrants | Northern Africa | 99.0 /100 | #100 | Exceptional 2.1% |
| Immigrants | Western Europe | 98.9 /100 | #101 | Exceptional 2.1% |
| Argentineans | 98.9 /100 | #102 | Exceptional 2.1% |
| Lebanese | 98.9 /100 | #103 | Exceptional 2.1% |
| Alsatians | 98.9 /100 | #104 | Exceptional 2.1% |
| Palestinians | 98.6 /100 | #105 | Exceptional 2.2% |
| Immigrants | Southern Europe | 98.6 /100 | #106 | Exceptional 2.2% |
| Slovenes | 98.5 /100 | #107 | Exceptional 2.2% |
| Immigrants | Netherlands | 98.5 /100 | #108 | Exceptional 2.2% |